


Led design at SoFiiT.
1 year / May 2024 – May 2025
Product design
0-to-1
Mental health

Team
2 co-founders
1 Designer (me)
1 Engineer
Recognition
Selected for the 2024 Techstars program.
(Techstars is a global startup accelerator and venture capital firm with an acceptance rate of less than 1%.)
What I did
Led the end-to-end mobile app and website design.
Refined the experience based on real user feedback, behavior patterns and user data.
Designed marketing materials including the website and in-person posters.
Outcome
Launched at USC with on-campus activations and live feedback loops.
Improved core flows through rapid design–feedback cycles.


Context
SoFiiT, a student well-being platform piloted at USC.
SoFiiT helps college students meet in person, work out together, and improve mental and physical well-being. Over a year-long engagement, we built and iterated the product with real on-campus feedback at USC.
Key features
Find workout buddies easily
Match with students in your school who share your interests.
Track workouts effortlessly
One-tap logging keeps your streaks going.
Discover activities around campus
See what’s happening and join in.
Background
Findings
University students are struggling with mental health.
74% Experience psychological distress
60% Feel lonely and isolated
40% Do not feel sense of belonging
Pain points & solution
Students
Trying to find someone to go out and workout with, but there is no one fit.
Students often drop out quickly, finding it hard to sustain exercise routines.
Universities
Too few activities are offered, or the activities are not accessible to many people.
Lack of timely ways to understand students' mental health, and low completion rates for related questionnaires.
How did we solve it?
From Matching to Moving
At first, we focused on matching users with similar interests, which can help ease anxiety to some extent. However, this single approach was too limited and didn’t address the root problem, as users might still end up chatting at home instead of exercising offline.
Therefore, we conducted some research and discovered that workouts can reduce depression and anxiety by 26%. This led us to combine workouts with user matching to solve this issue.
Design iteration
Iteration 1
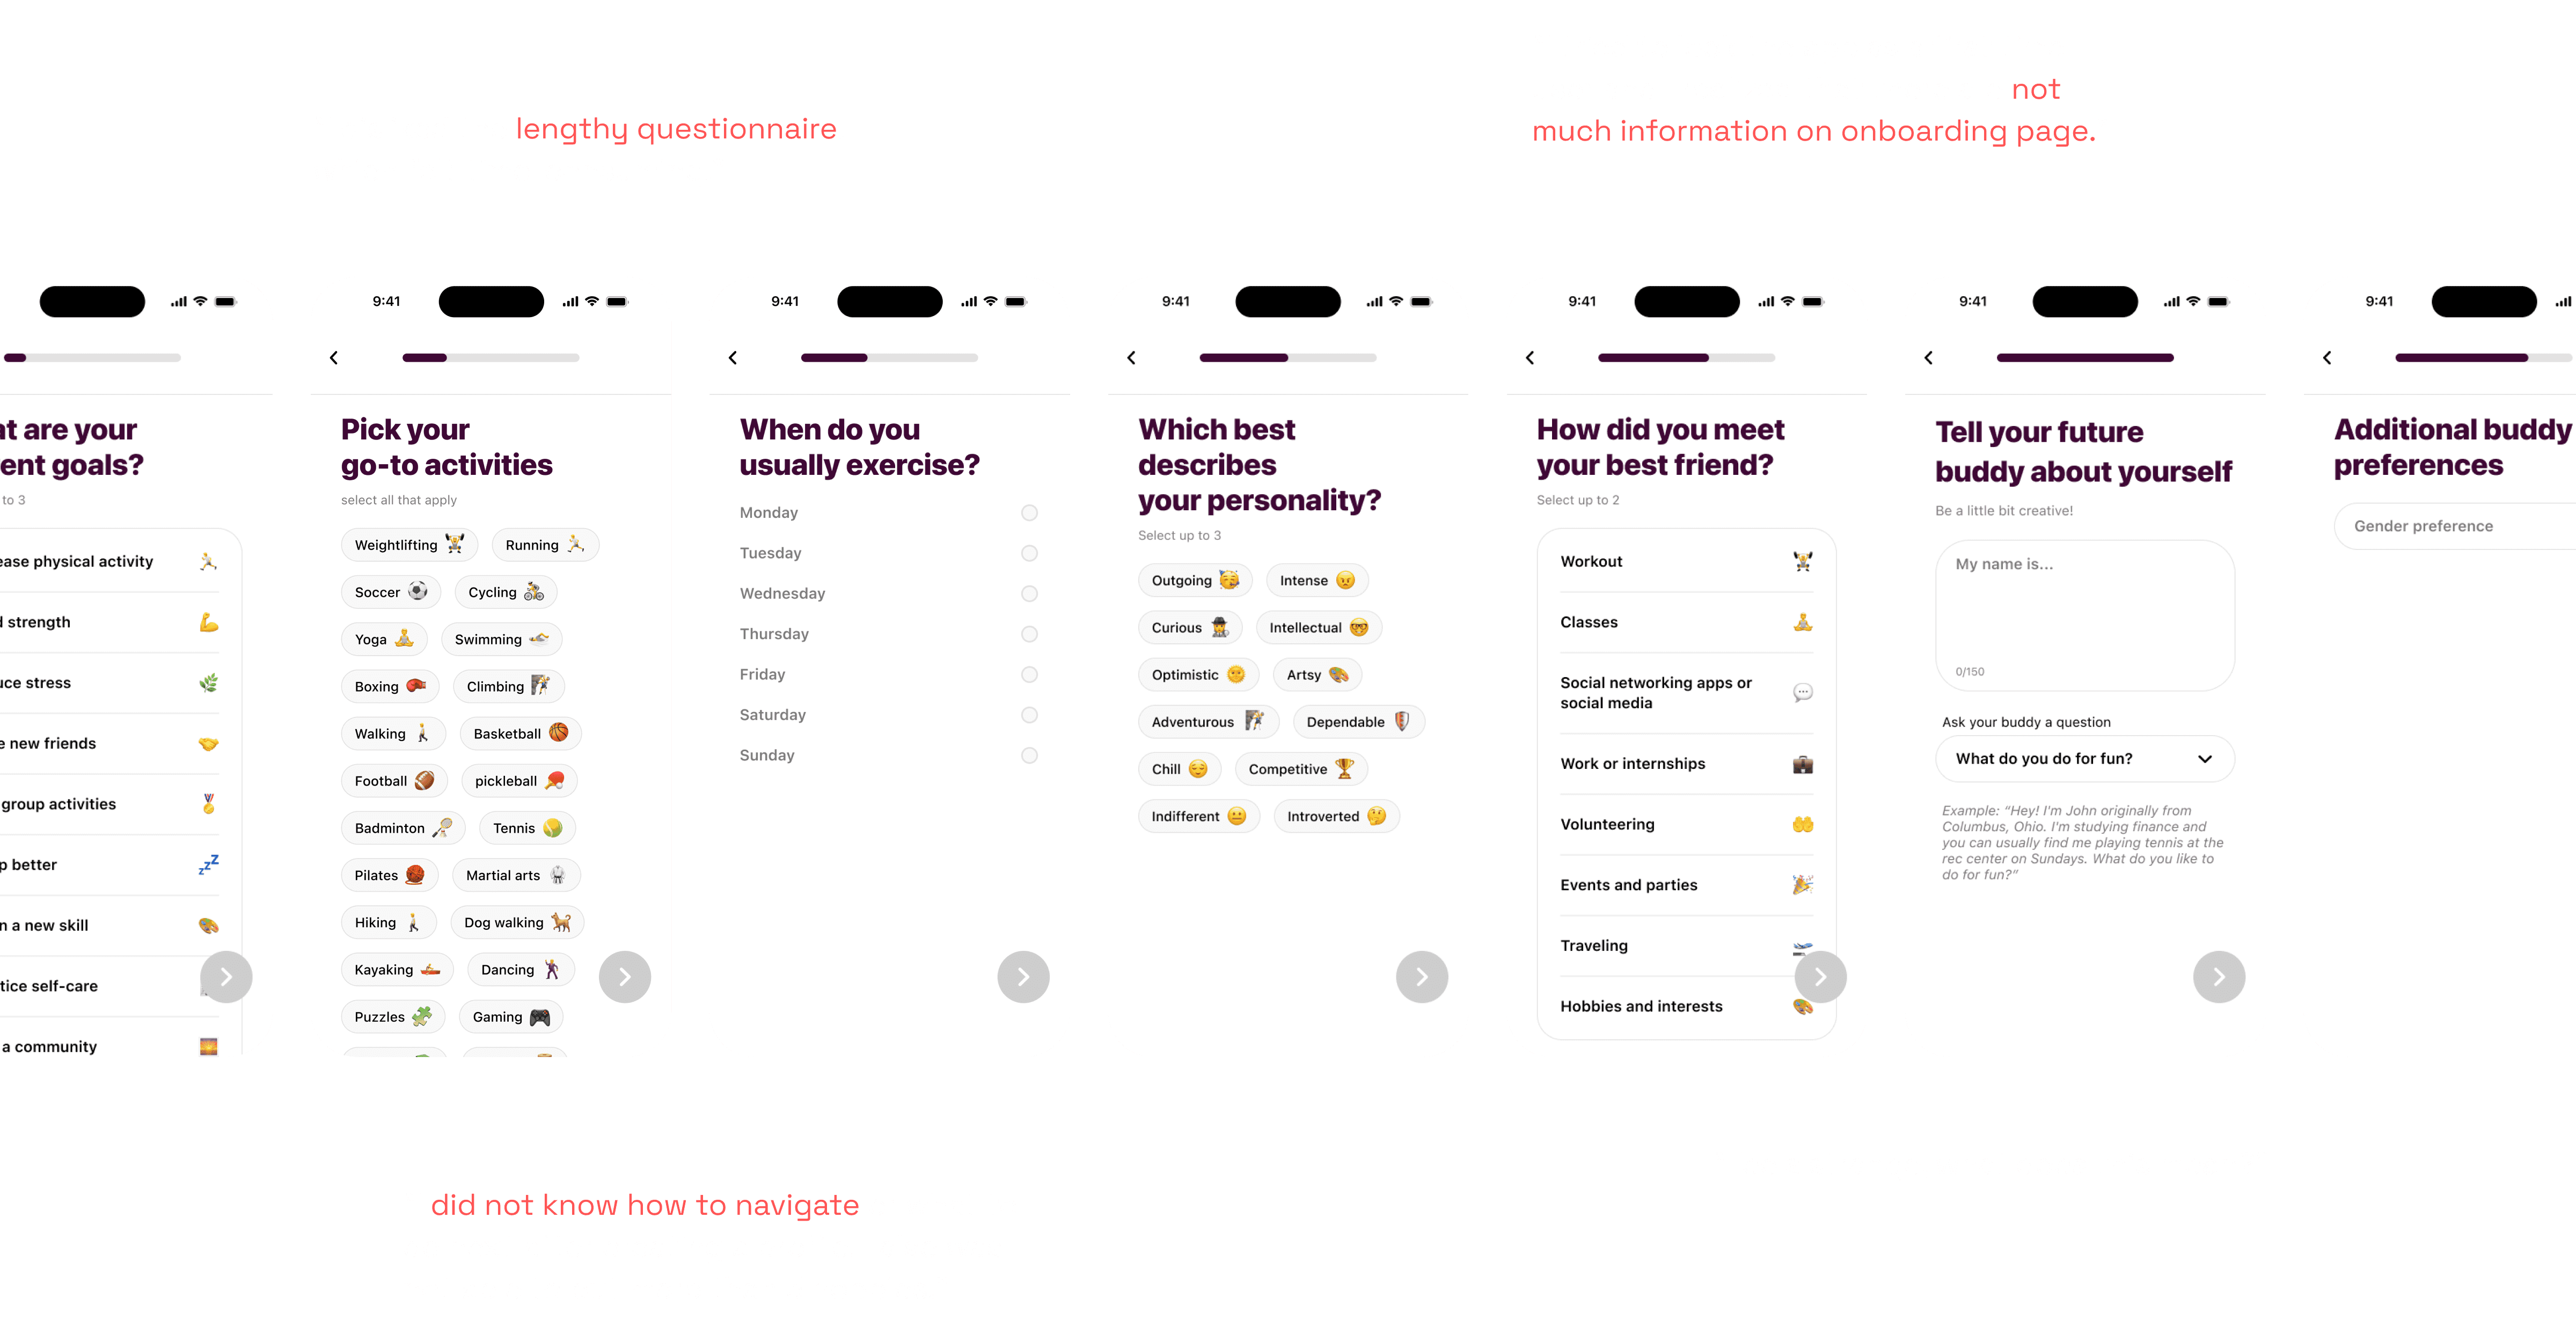
Onboarding low completion rate
Onboarding issues prevent users from successfully landing on the platform.
We need to understand students’ preferences in order to make better matches. However, the current flow is too messy, and we also identified a data issue: only 29% of users completed filling out their match preferences during onboarding.
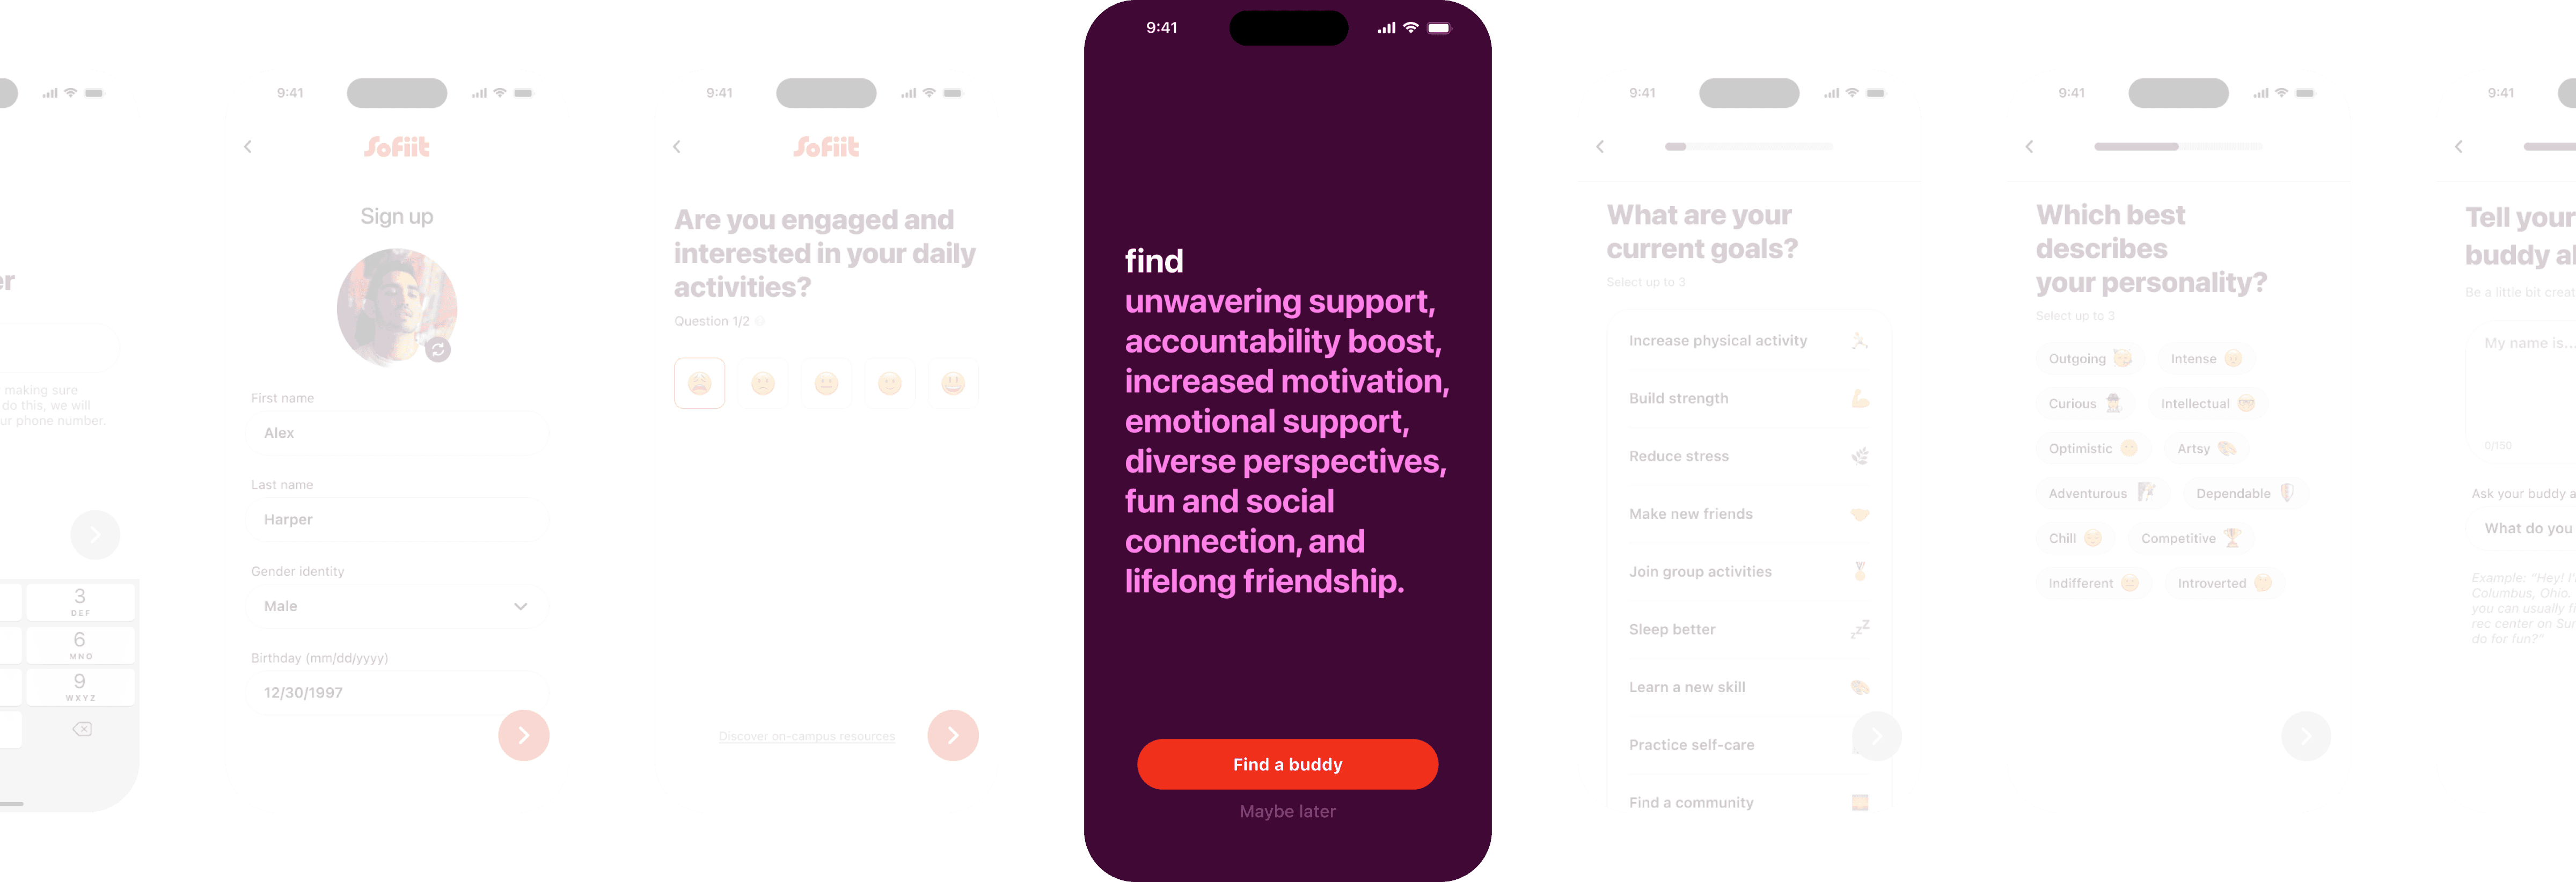
Previous onboarding user flow

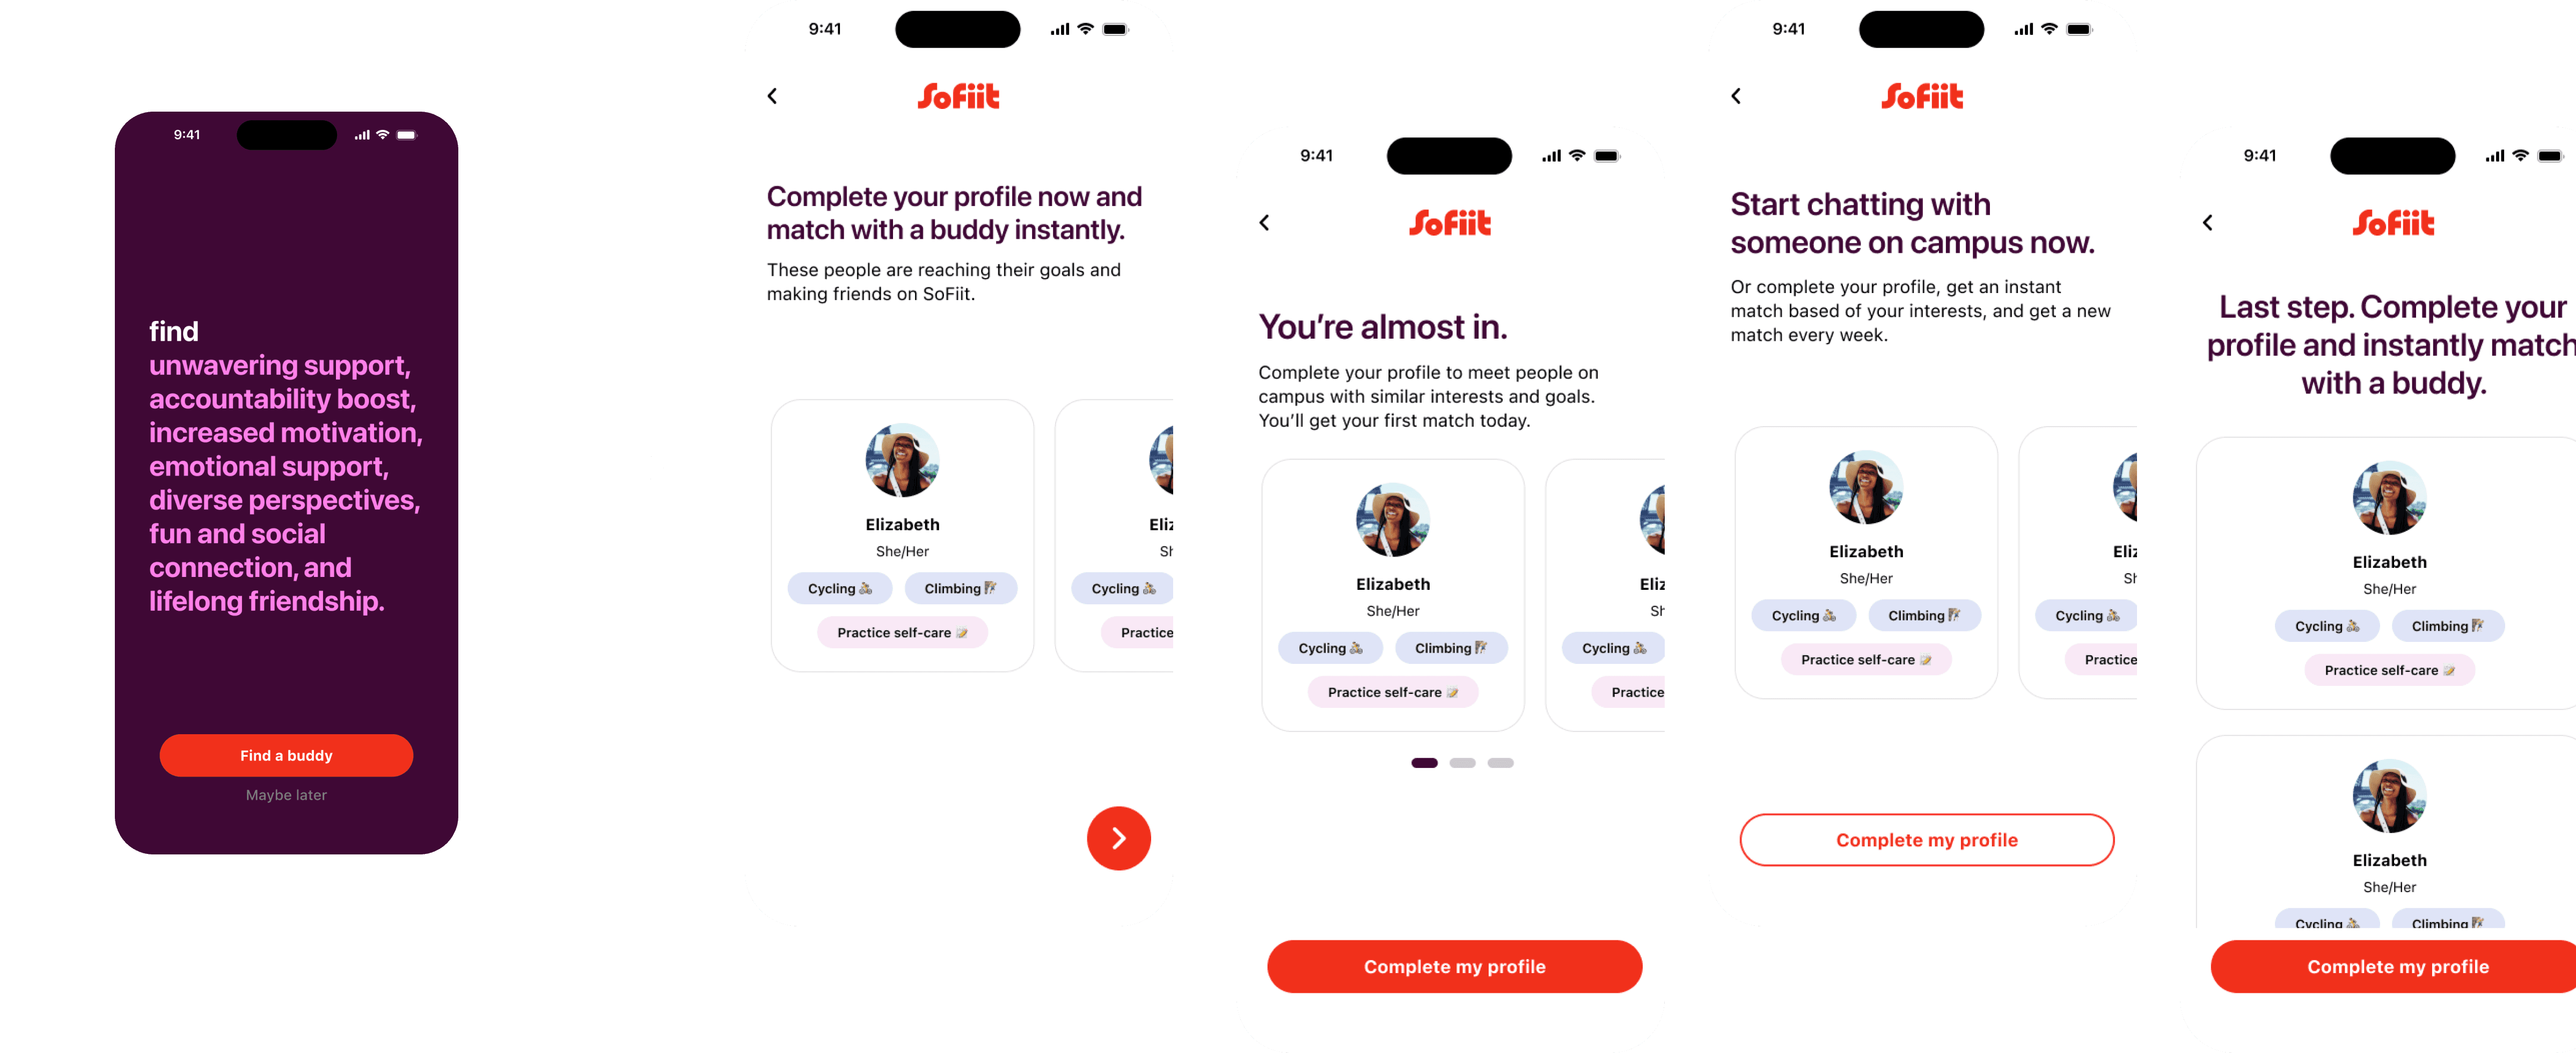
Reorganize the flow

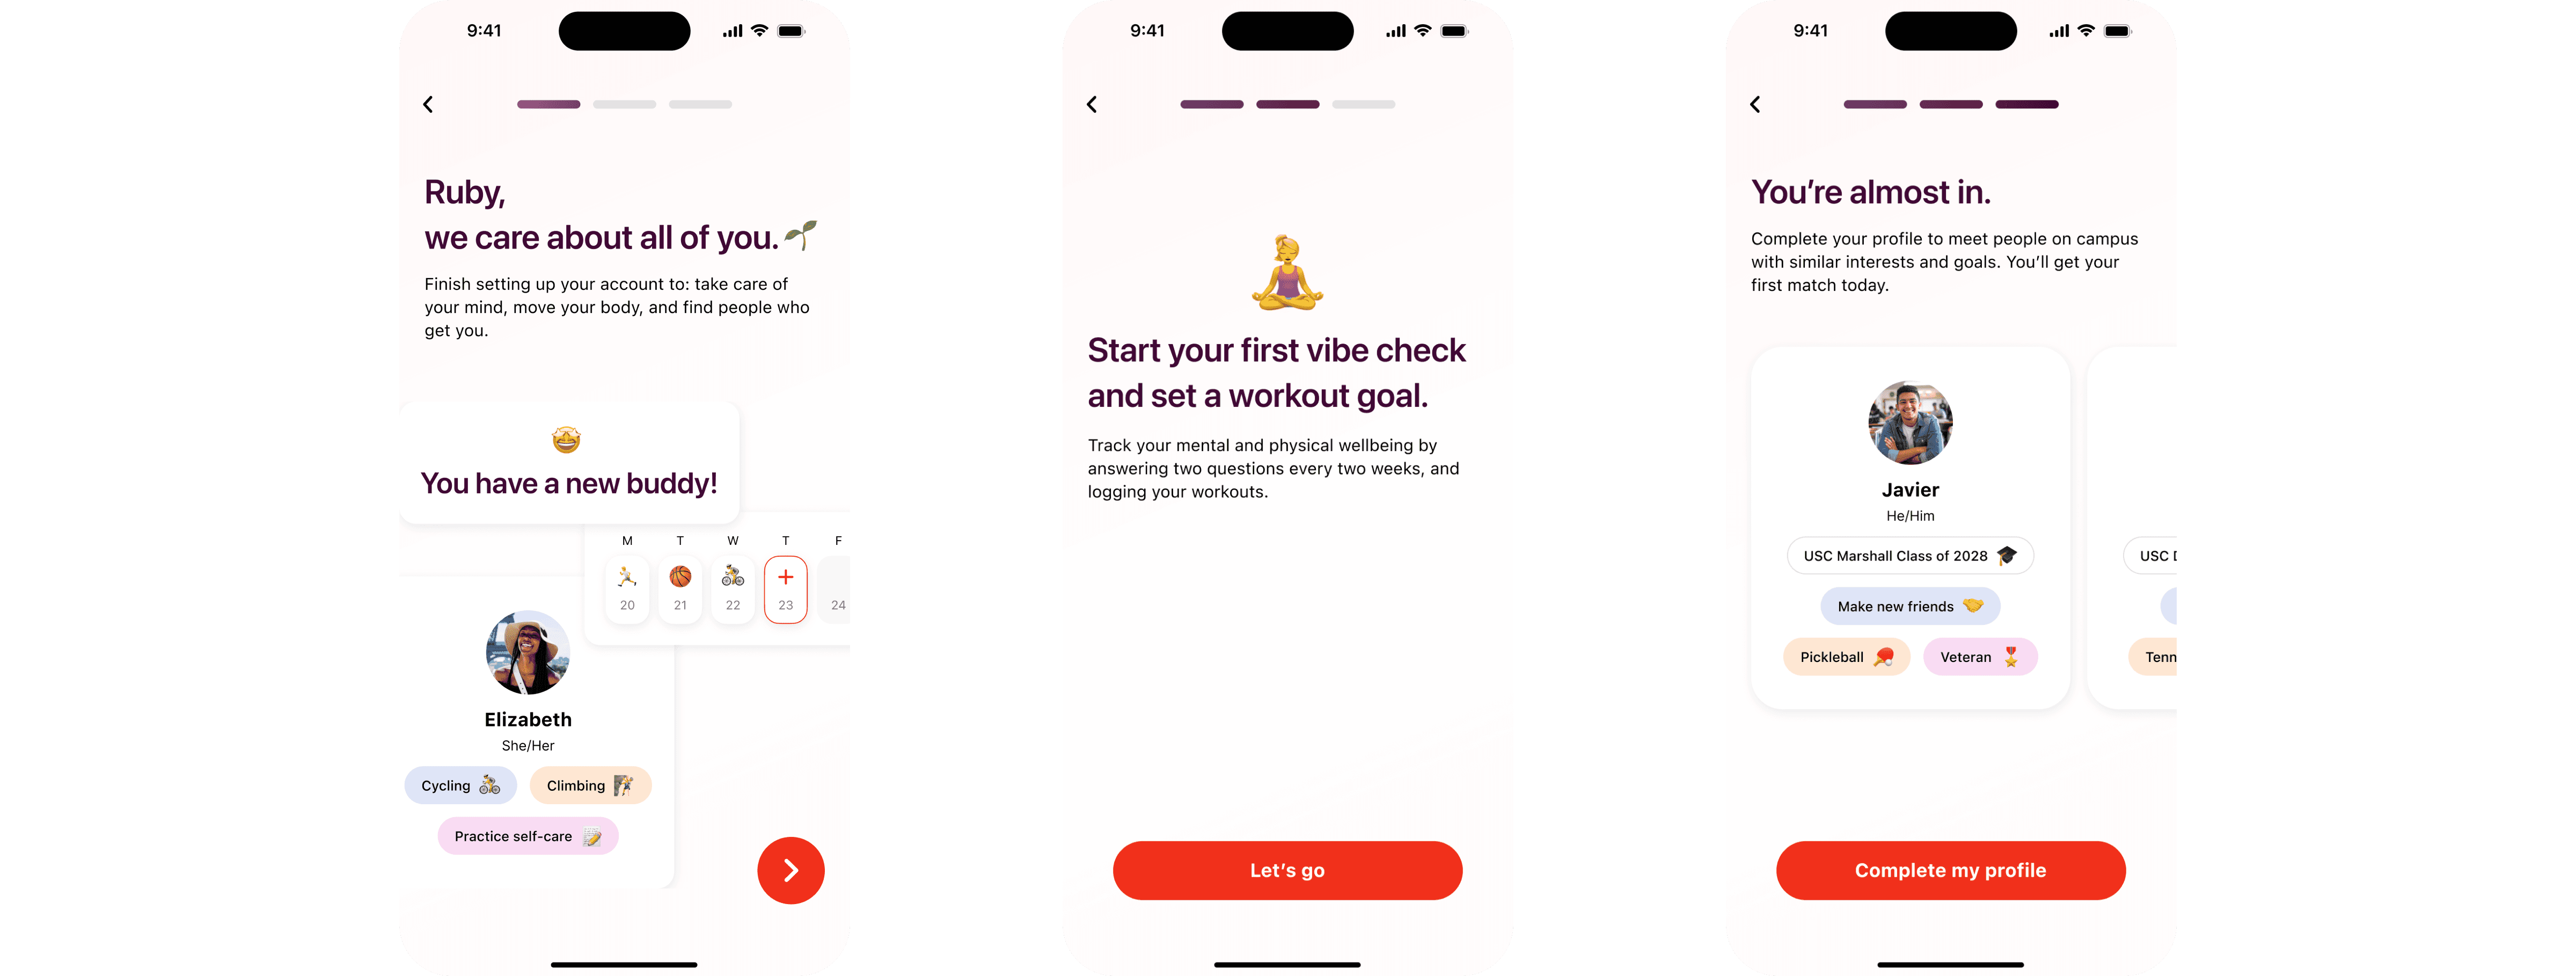
Final design
Achieved a 68% completion rate for matching preferences.
Iteration 2
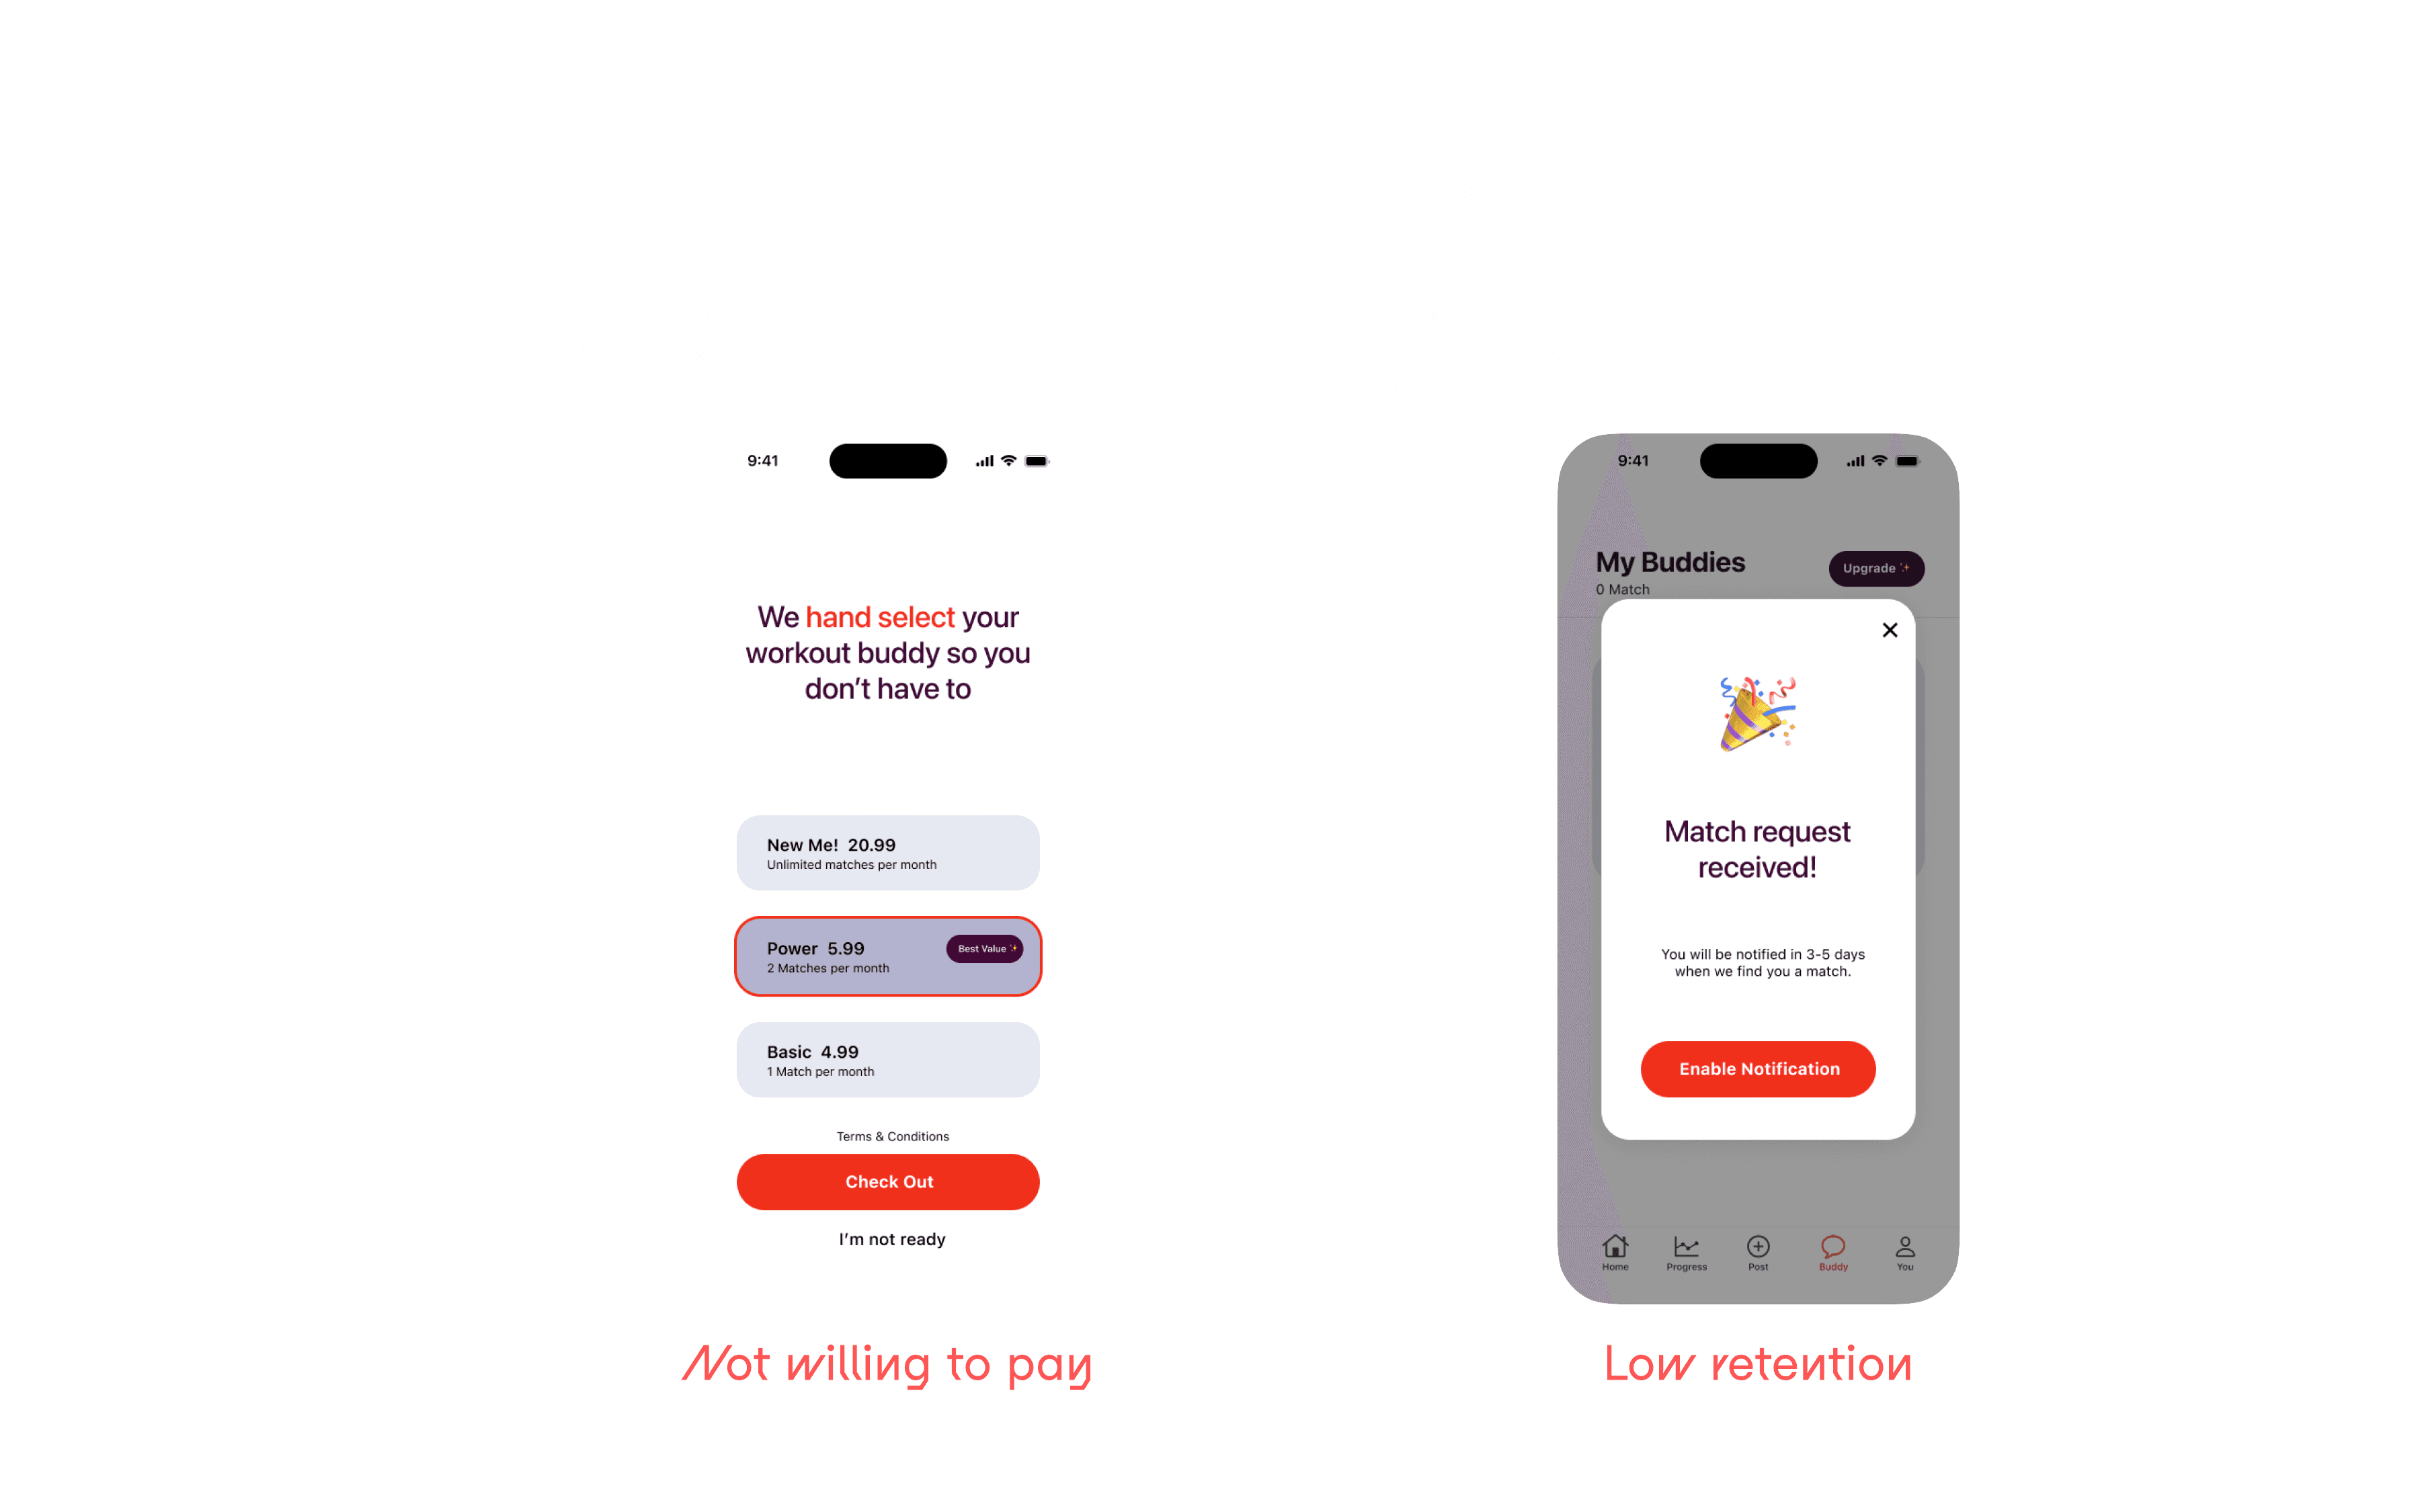
Matching mechanisms
Conventional matching mechanisms are not compelling enough to attract users.
Our goal is to keep users engaged on the platform while helping them find the right match. We explored and tested three different directions.
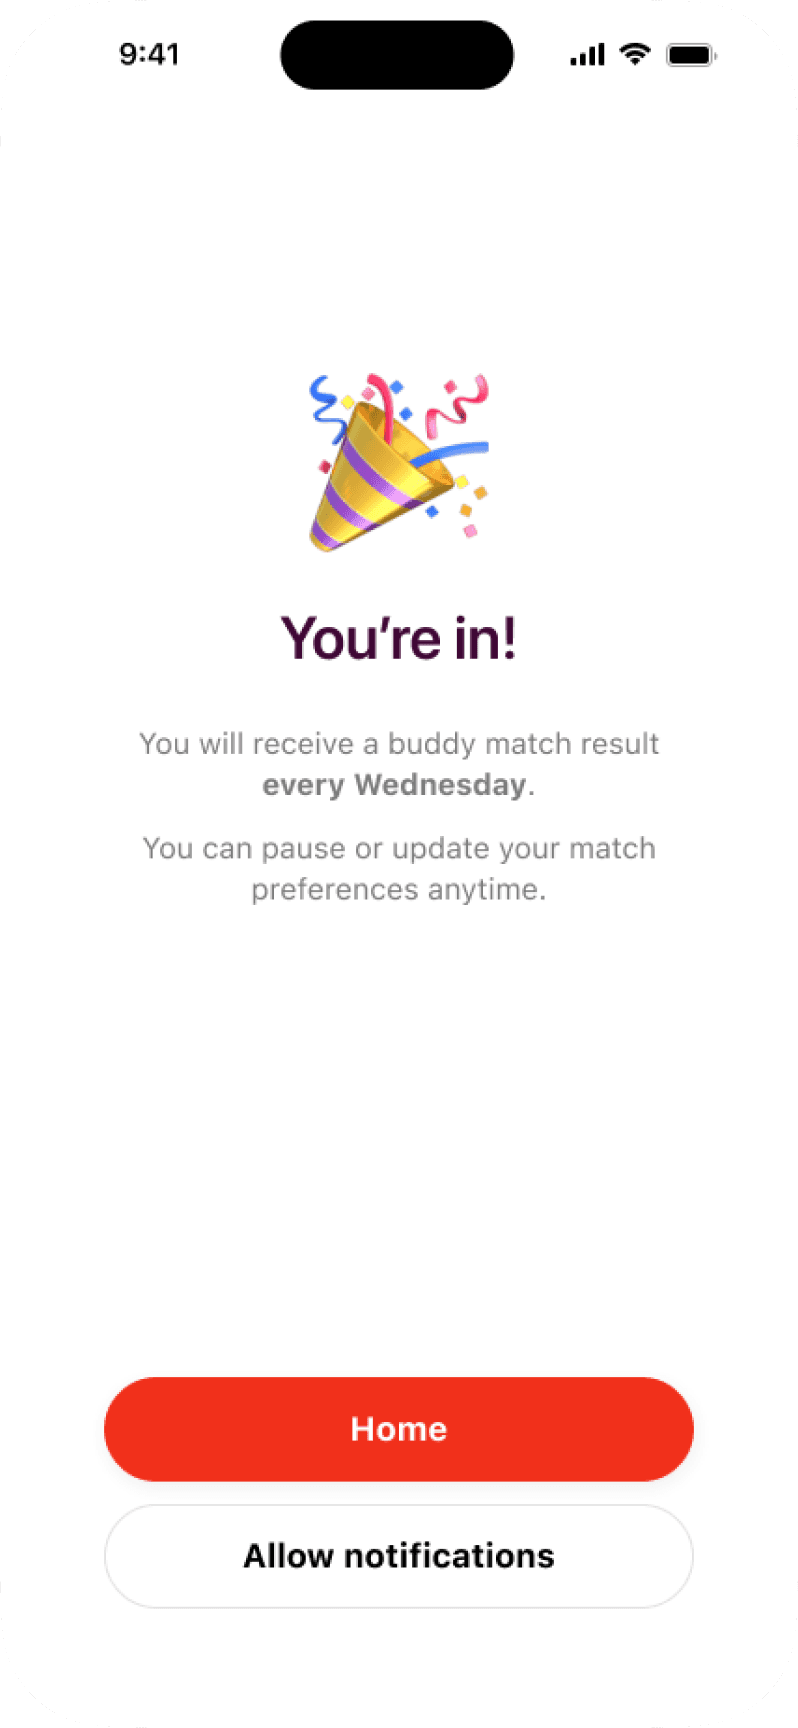
Final design
Automated matching
Resulting in a 42% increase in 14-day retention after release.
This solved the problem by removing the need for manual actions. Users receive three “surprises” every week.
Iteration 3
Low effective conversation rate
Users don’t want to start chatting after being matched.
In our internal focus group testing, 83% of participants were either unwilling to start a conversation or didn’t know what to say.
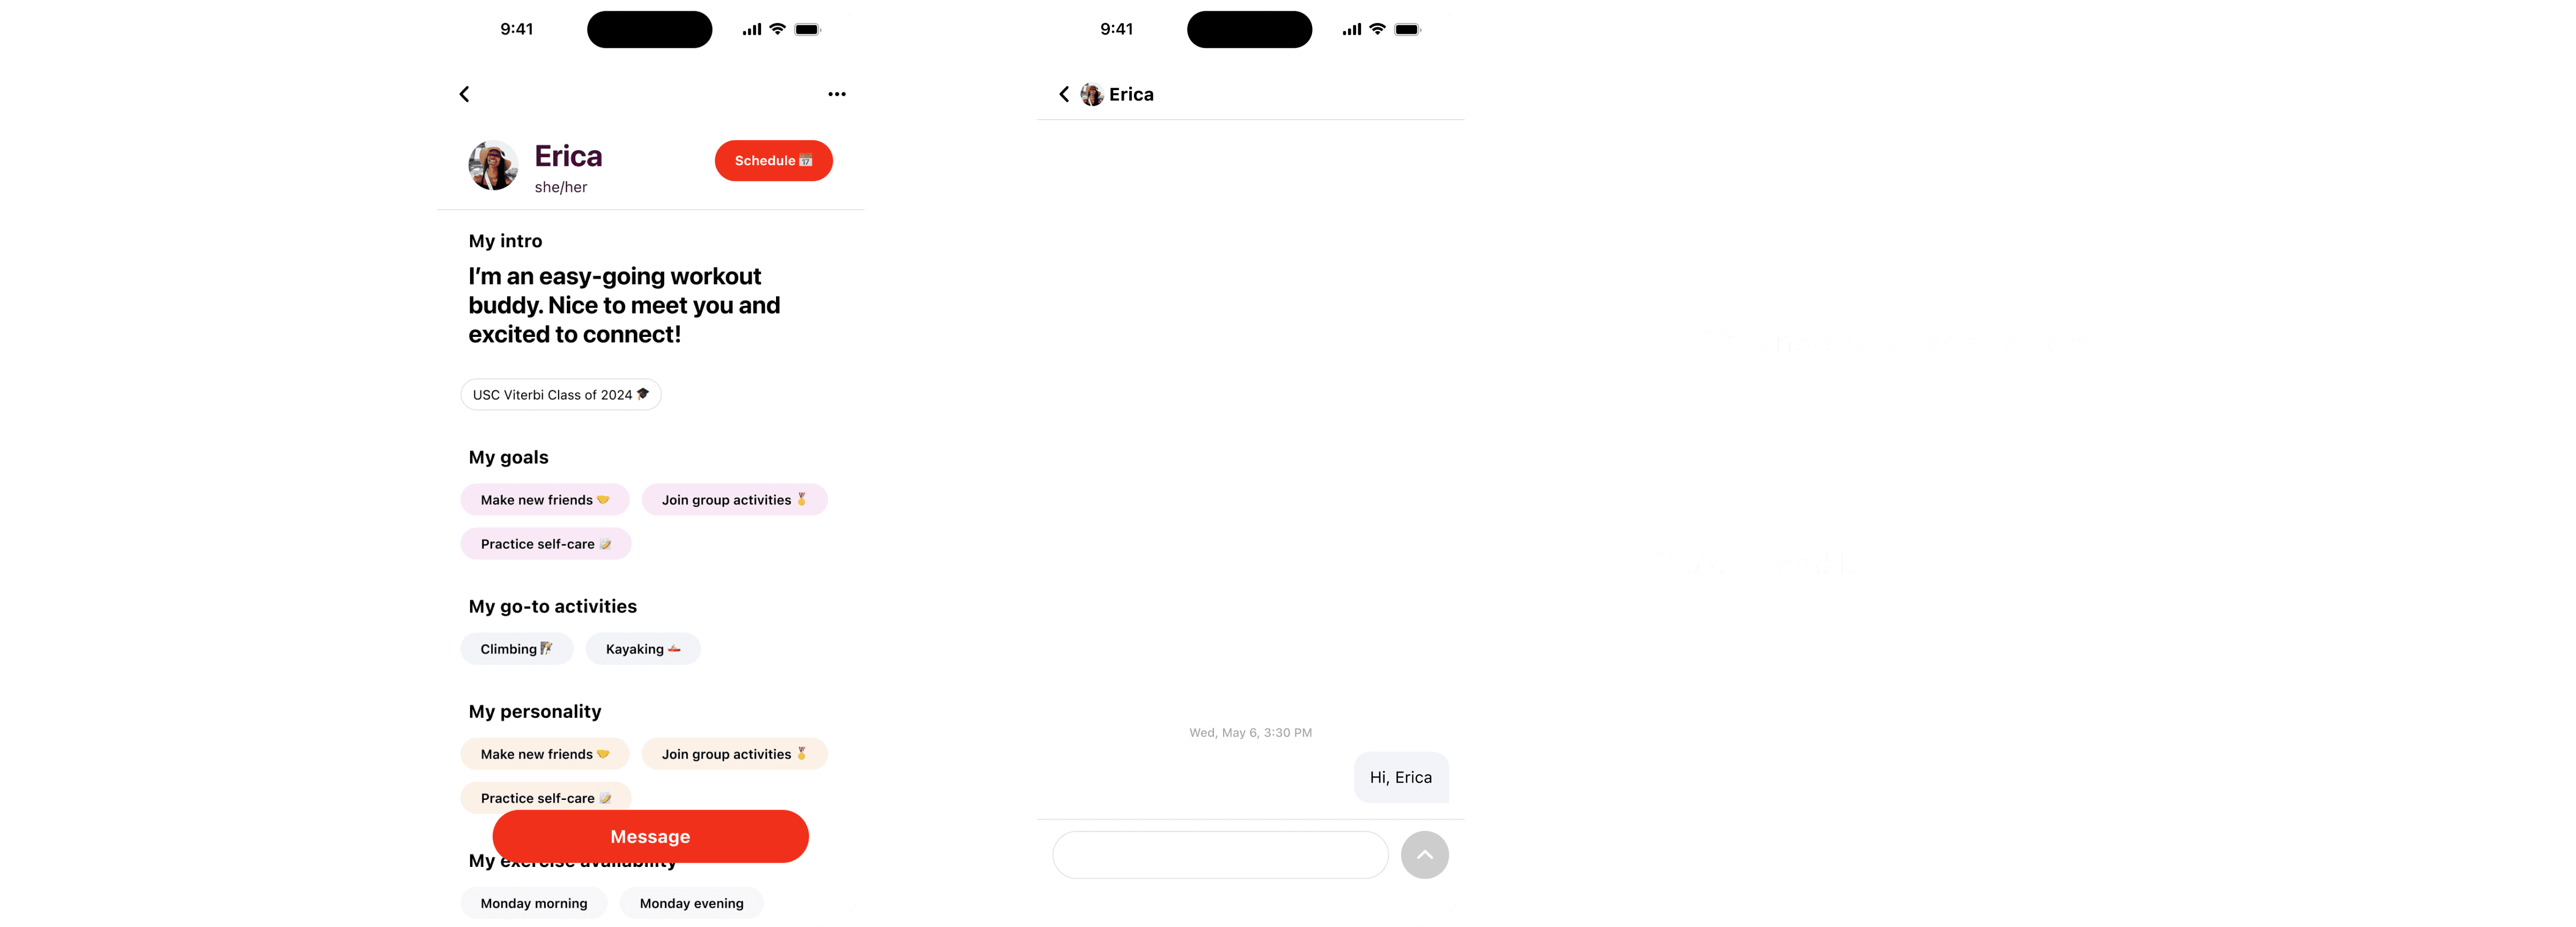
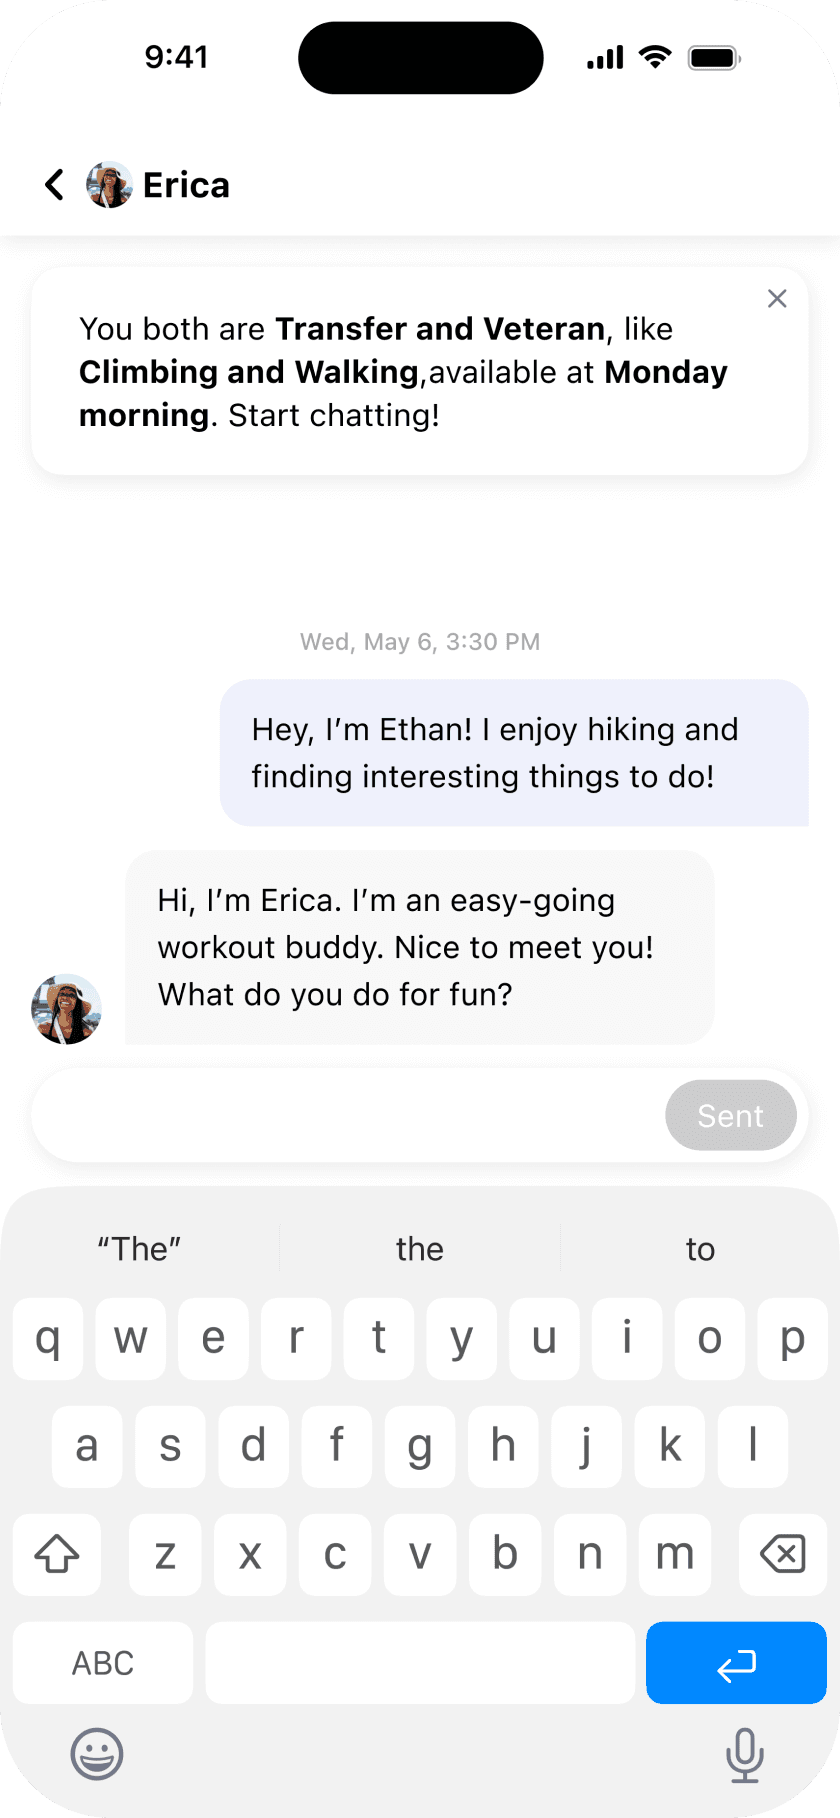
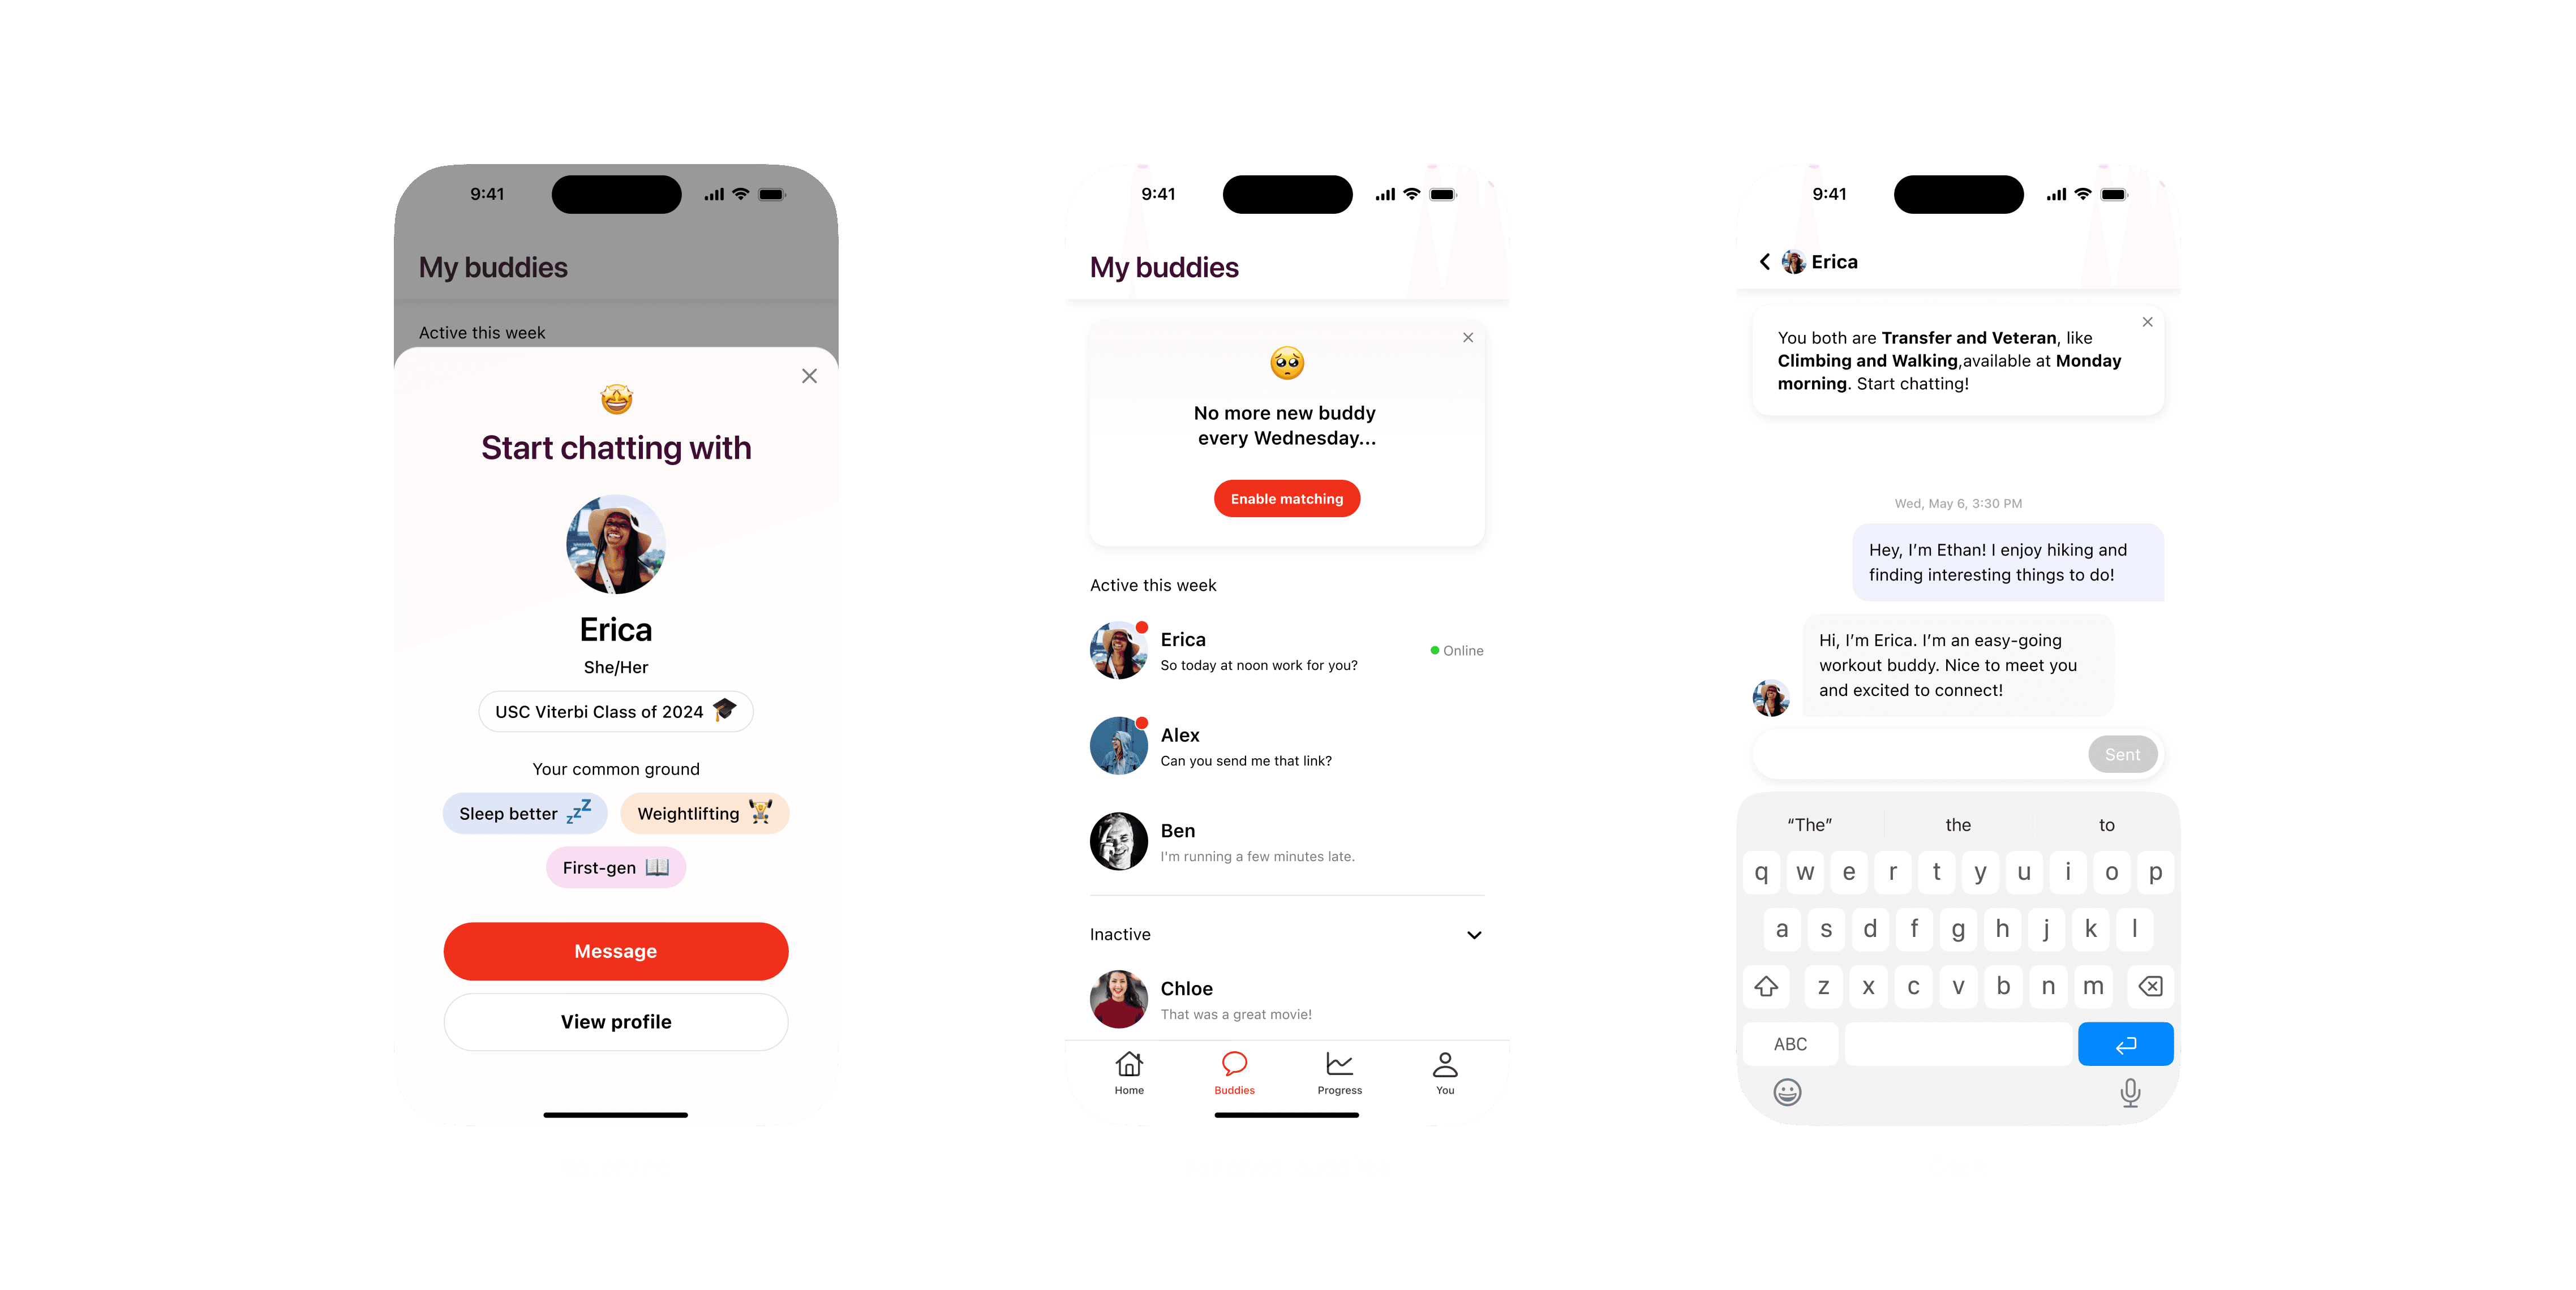
Final design
Meaningful conversation starts rose from 12% to 34%.
Instead of just showing profiles, AI highlights shared interests and automatically sends an intro with a starter question to help the chat begin instantly.
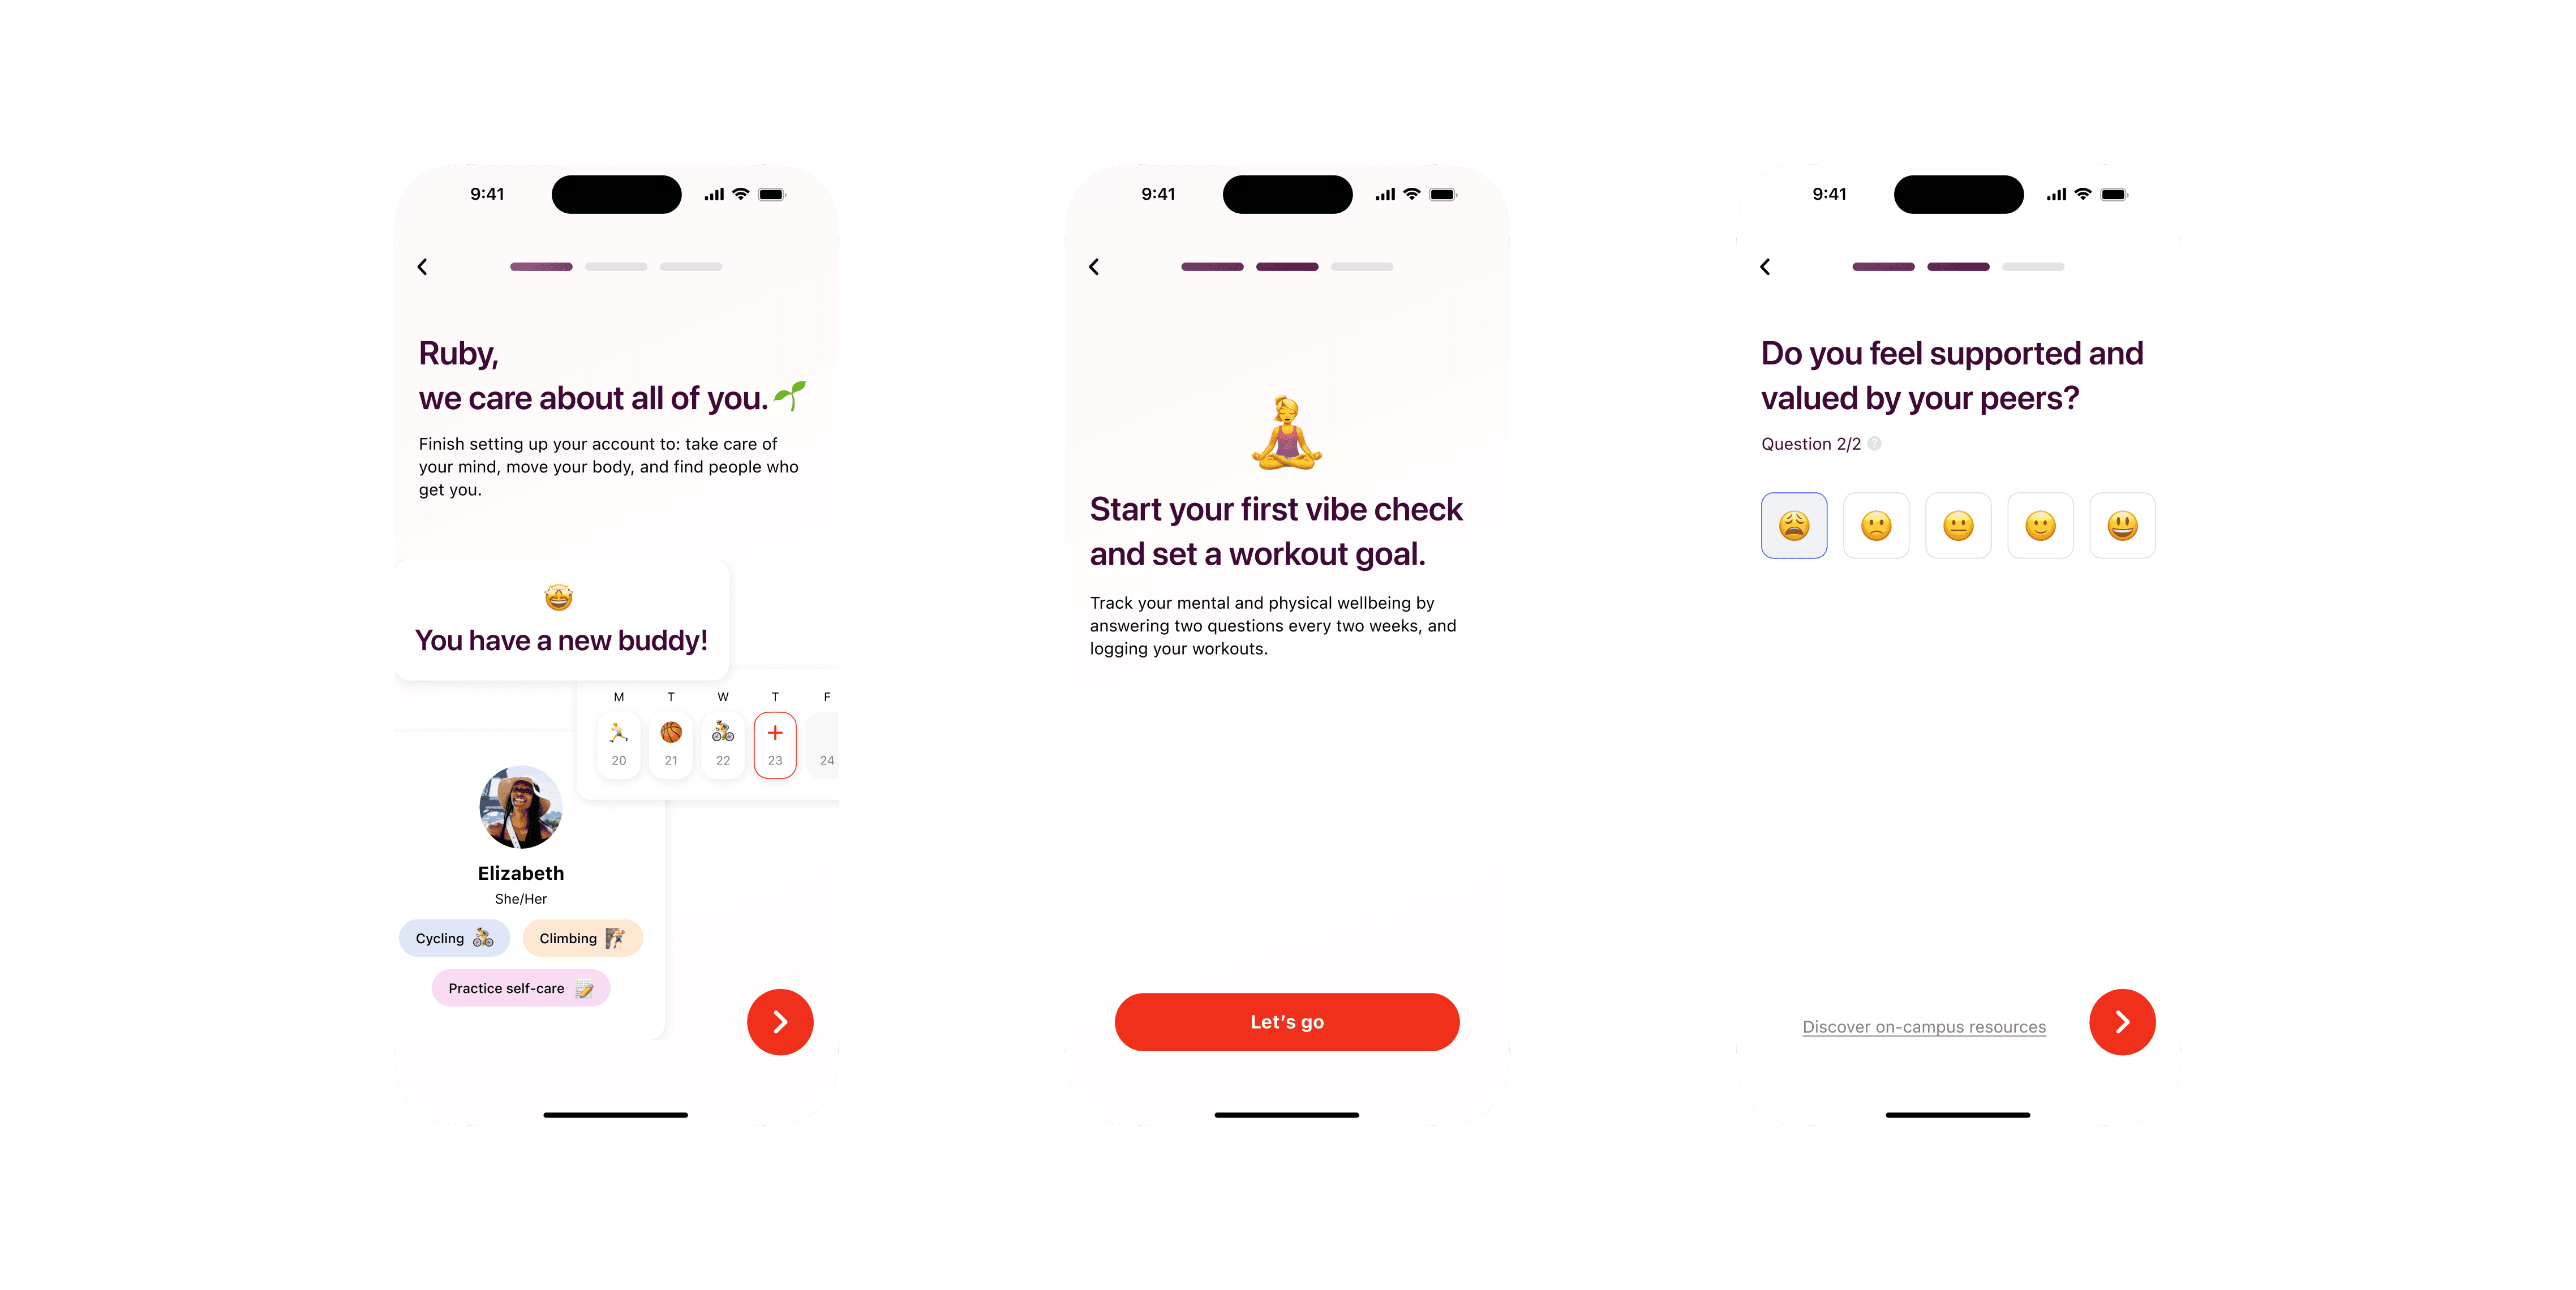
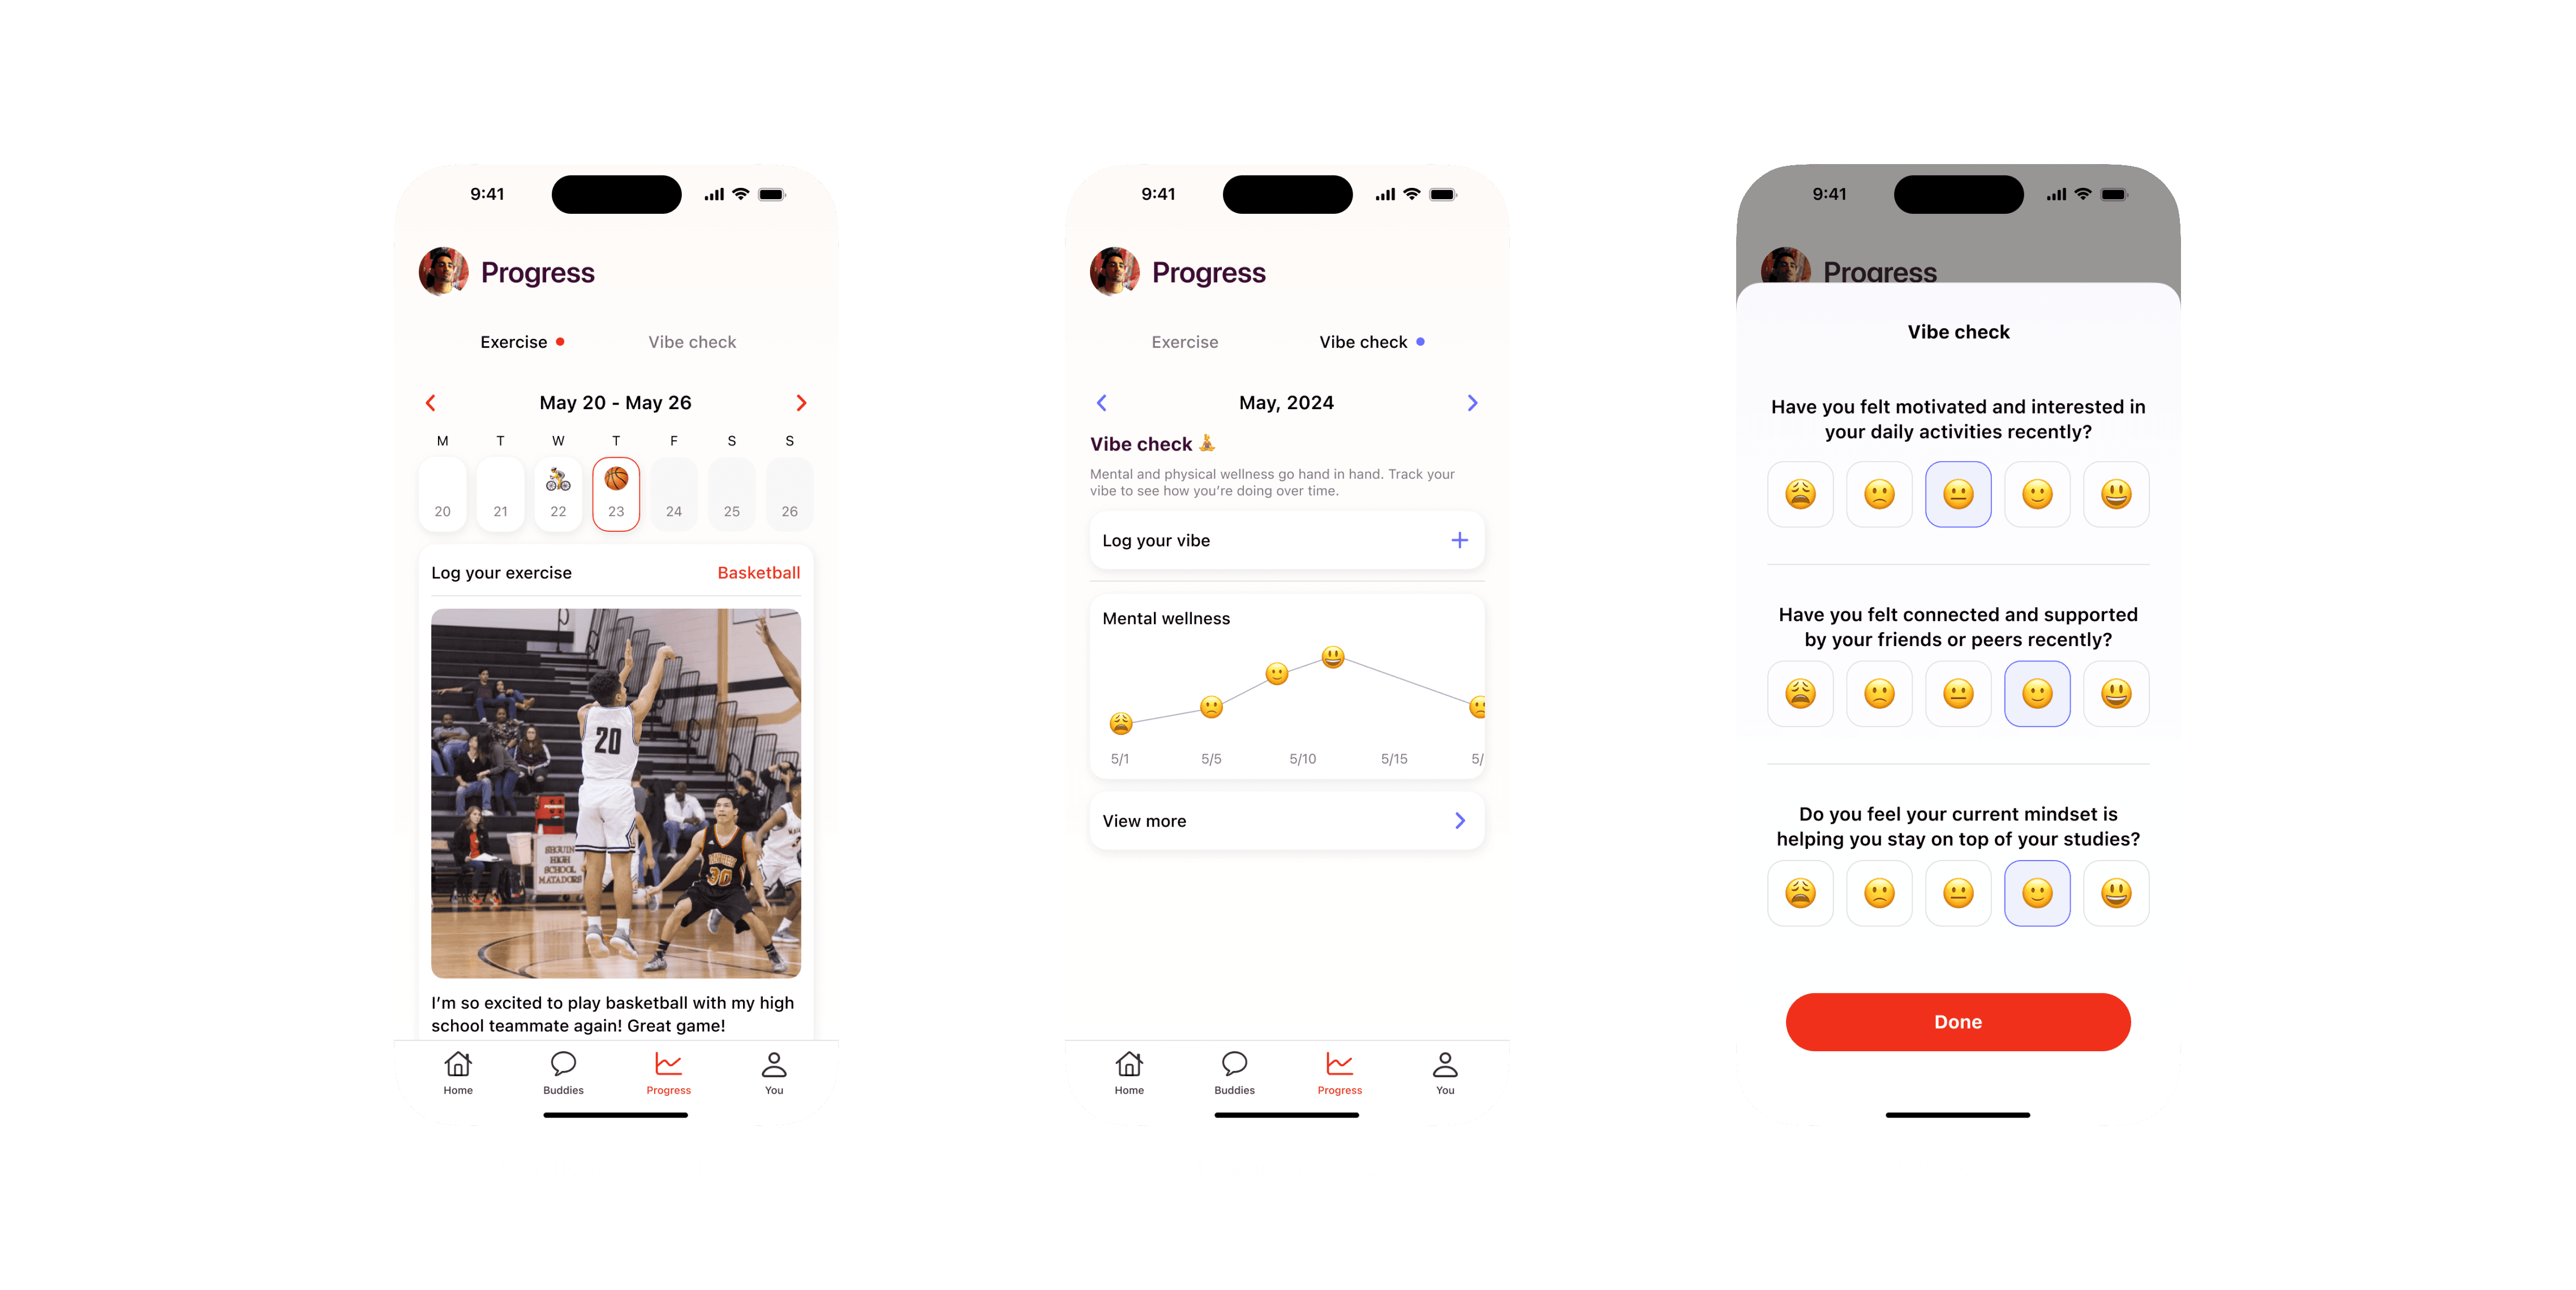
Final design
Onboarding
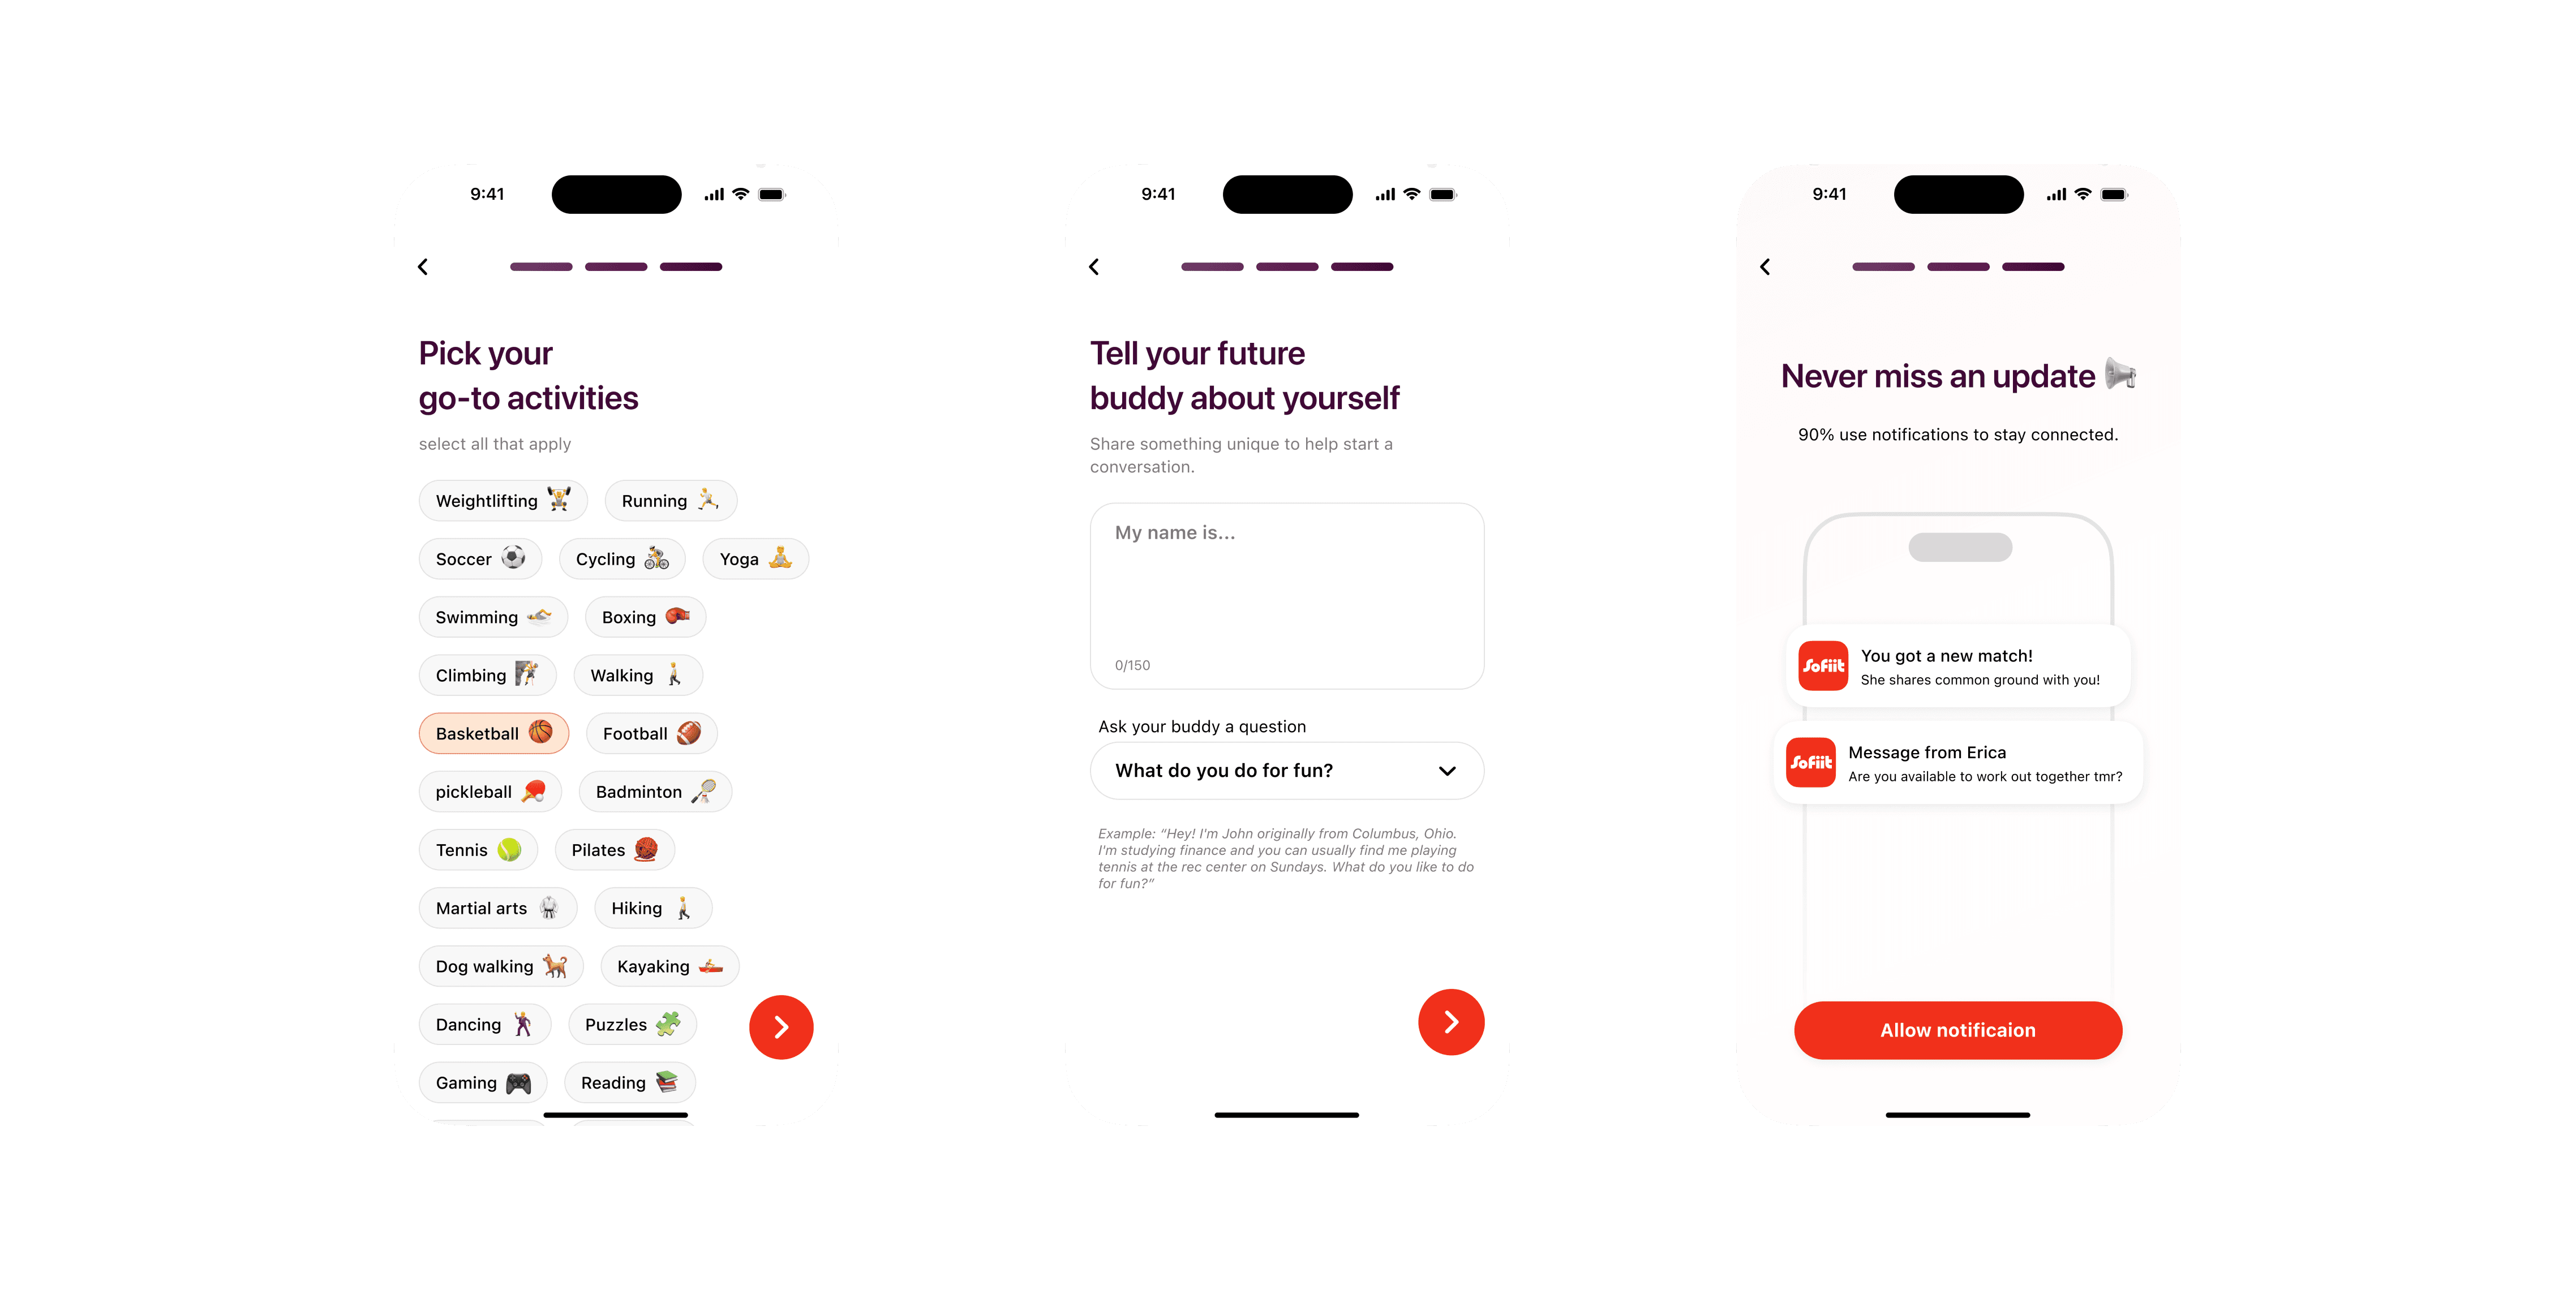
Matching
Activities
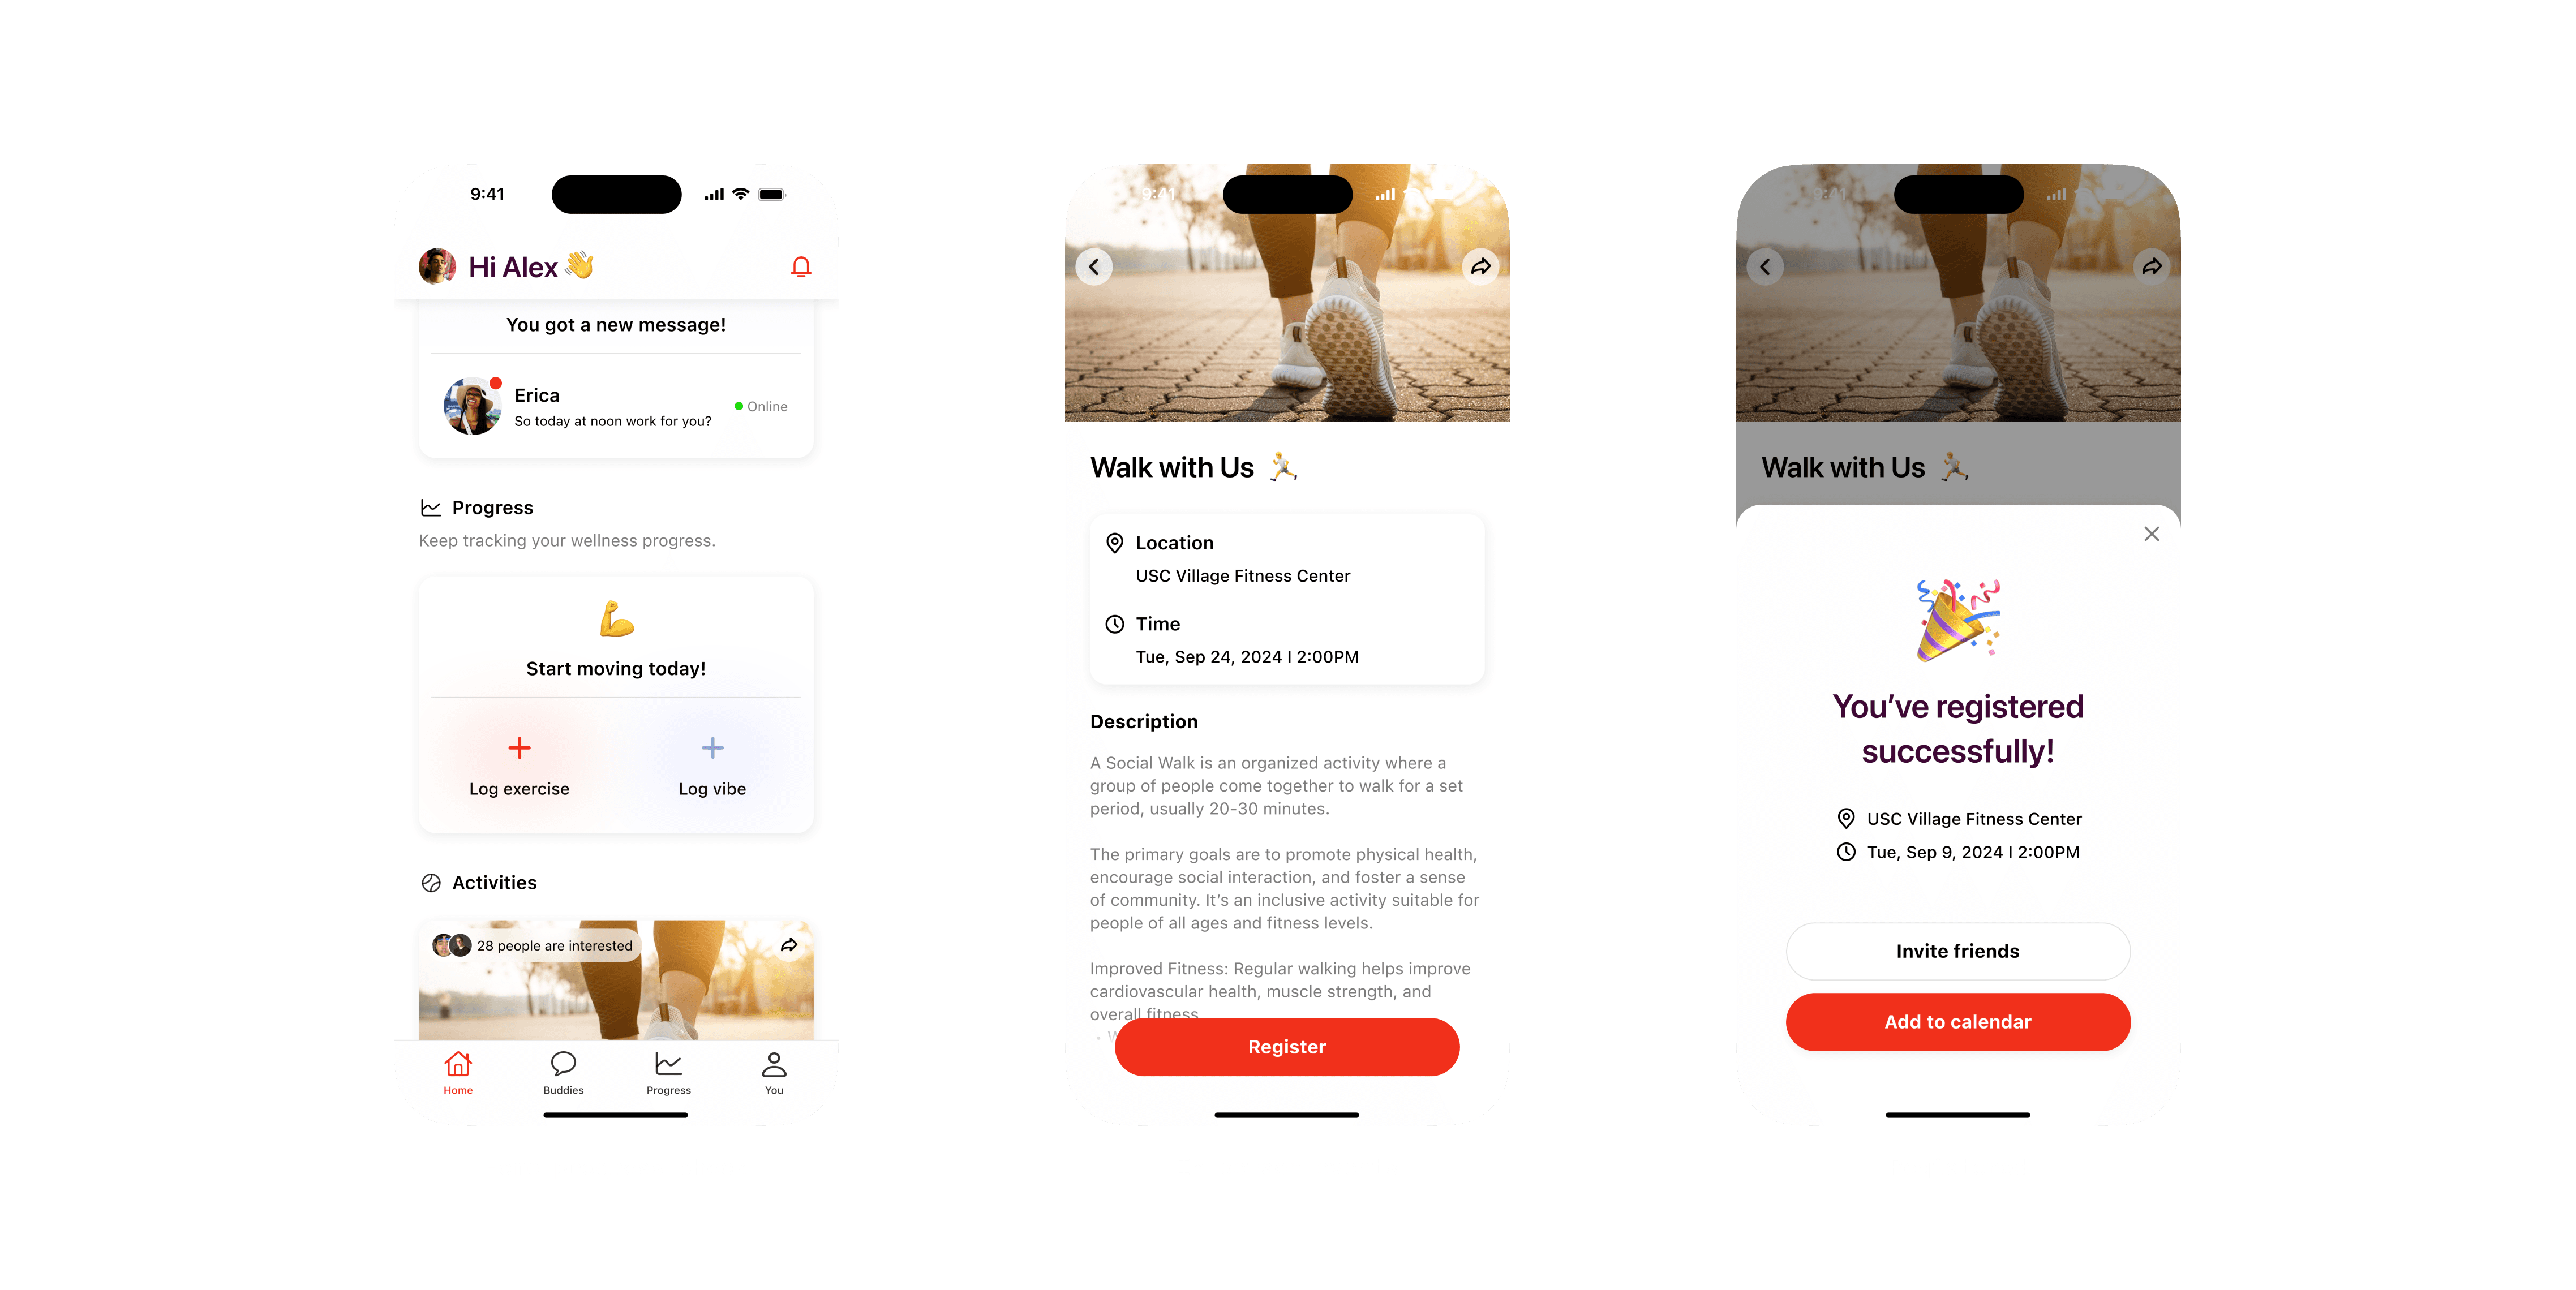
Log exercise & vibe
Reward system

Results
How we measured success?
Optimized user journeys using heatmaps and focus group feedback, leading to a 27% faster onboarding completion time and higher satisfaction.
Refined the mechanism and design to make the experience more engaging, resulting in a 42% increase in 14-day retention after release.
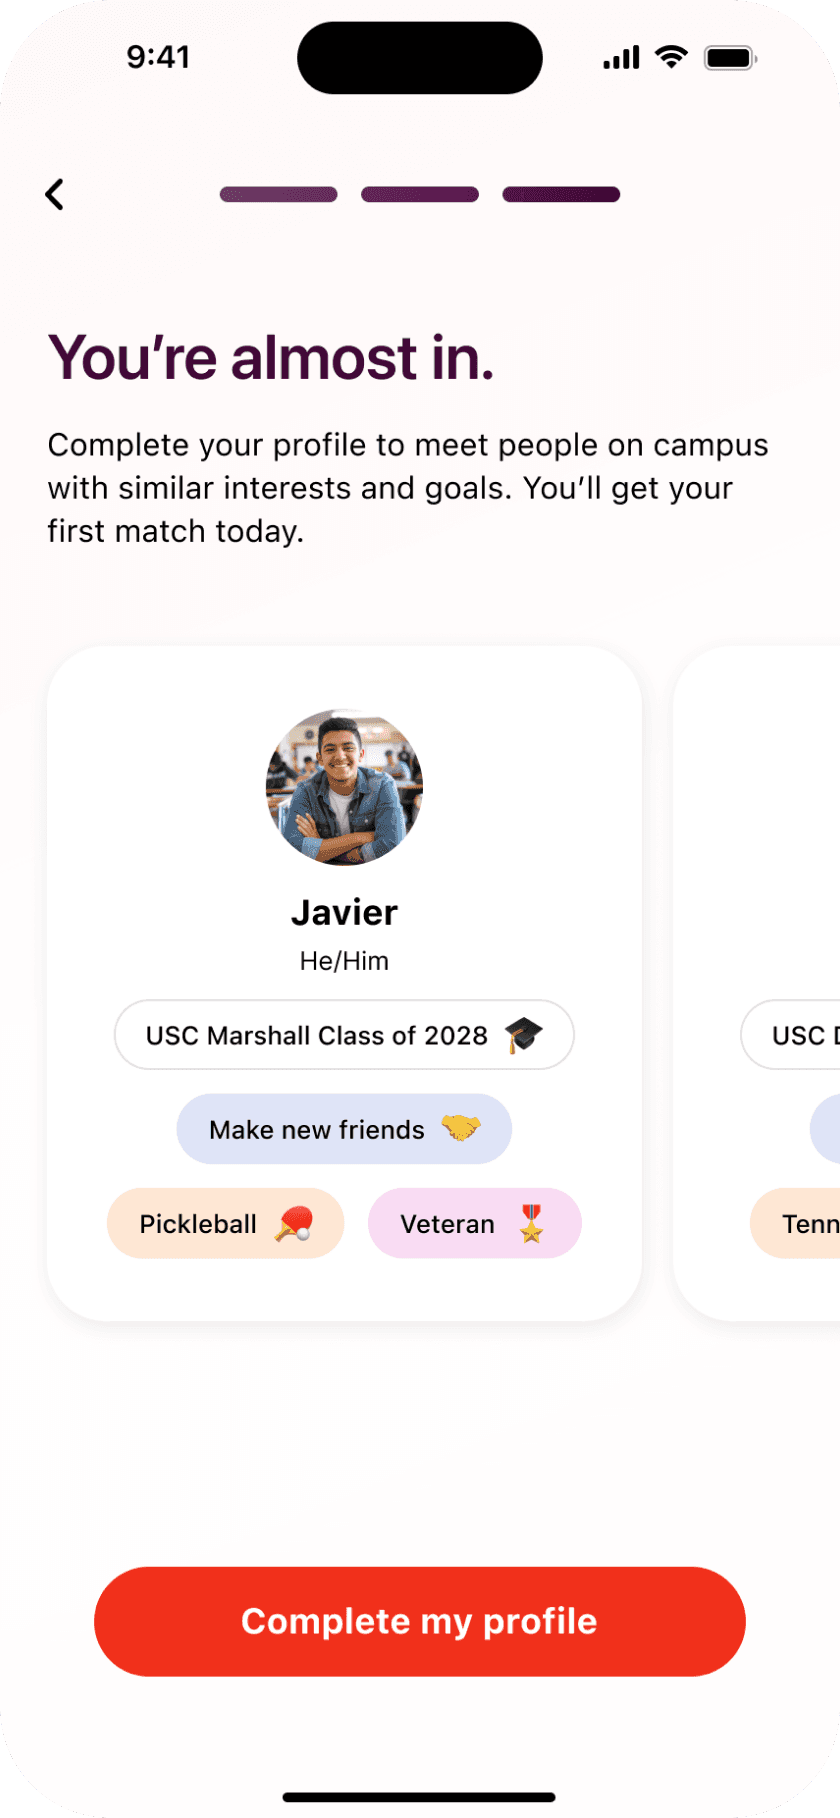
Enhanced the final onboarding step through micro-interactions, real user profiles, and subtle visual cues, achieving a 68% completion rate for matching preferences.
Added interactive elements that encouraged users to reflect and log their journey, contributing to a 26% increase in logging activity.
Reflection
Launched at USC with measurable impact, achieving 27% faster onboarding, 68% completion rate, and 42% higher retention.